
Daily brief · 2026-11-09
Historical edition · New York time. These observations reflect their published date, not current market conditions.
Futures bounce again under the broken floor — CPI decides tomorrow
second bounce day, still no repair: futures rise under $750.36 while December hike pricing near 78% waits on Tuesday's CPI
Chart analysis
Published chart · Tap chart to enlarge.
Published chart lesson
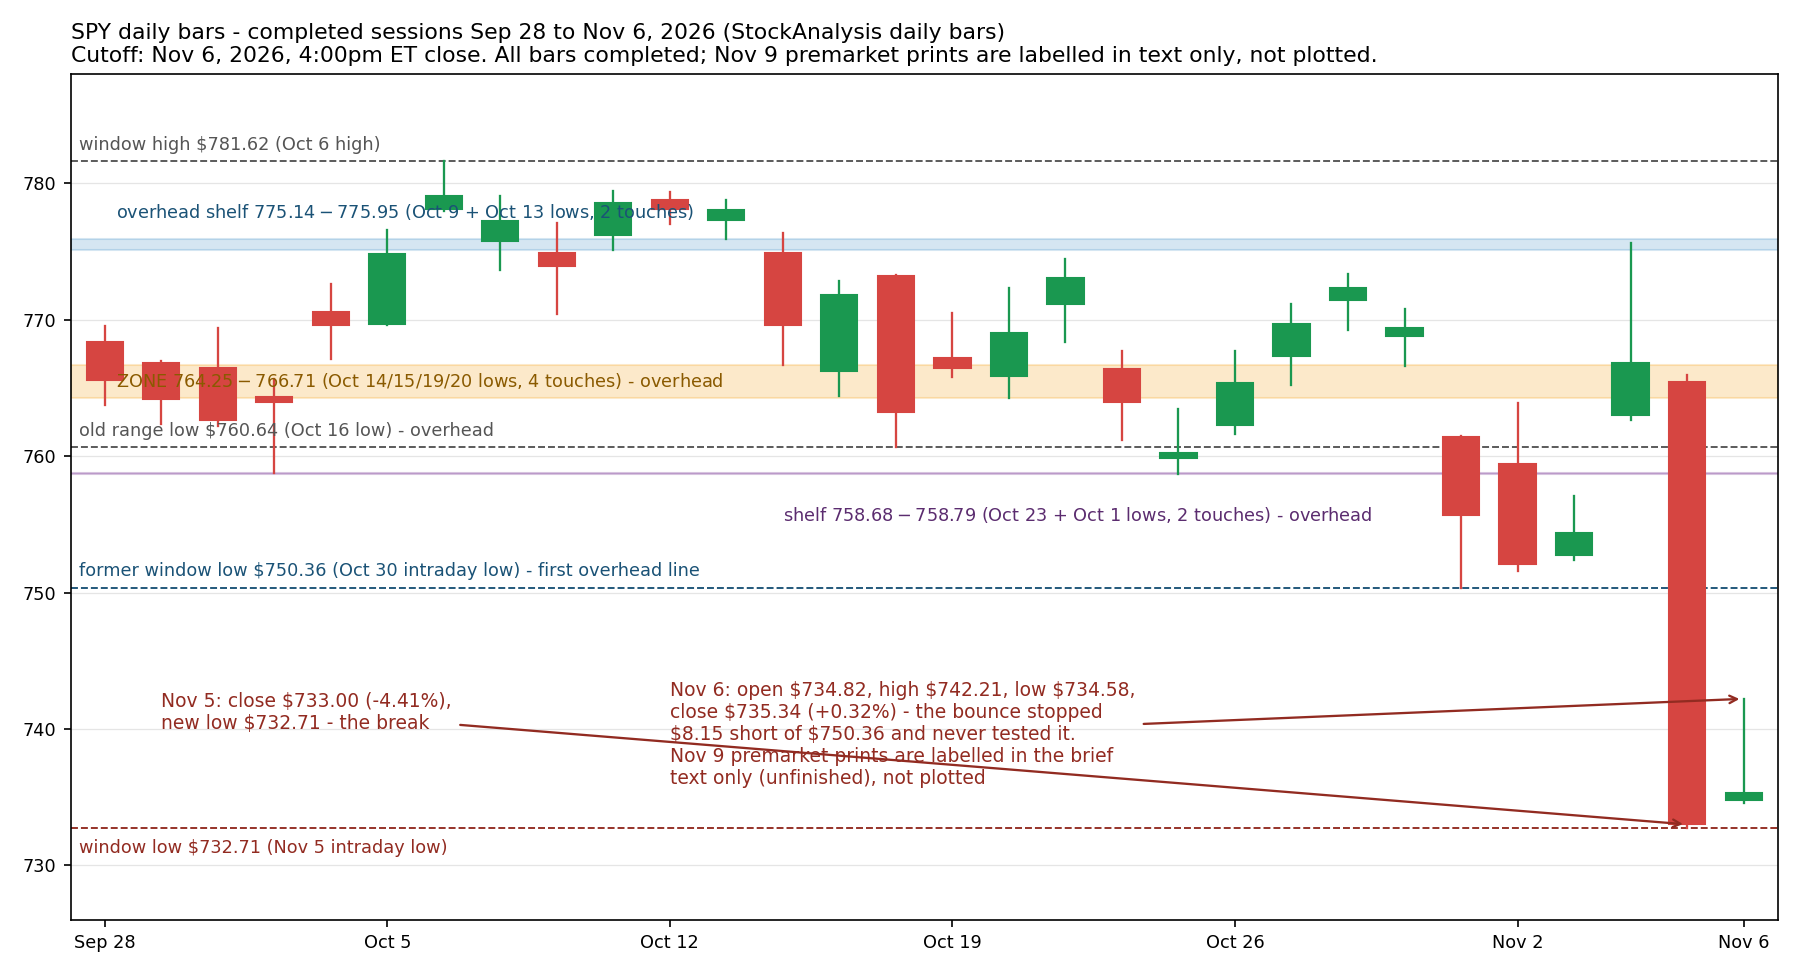
A bounce that never reaches the broken level has not tested it — two days running. SPY's former window low is $750.36, the Oct 30 intraday low (StockAnalysis daily bars); Friday's completed bar reached a high of $742.21 and closed at $735.34, and this morning's premarket print of $741.94 at 8:41am ET (Finnhub, unfinished) is also below $750.36, so the recovery so far trades underneath the broken floor — that is a bounce inside the lower part of the Sep 28–Nov 6 window, not a retest of $750.36, and it is not established support either. What would weaken or change the lesson: a completed close back above $750.36, followed by a retest of that line from above that holds, would show the level being tested and starting to work from the other side; a completed close below $732.71, Thursday's intraday low, would extend the break instead and leave the lesson intact.
Brief analysis source: SPY daily, StockAnalysis, Nov 6 2026 . Chart uses its own dated Yahoo series; vendor levels can differ.
Three key points
- Monday has no 8:30am ET release, and futures rose into a positioning morning: Dow futures up 0.95%, S&P 500 futures up 0.59% and Nasdaq-100 futures up 0.47% at 7:20am ET, with Nvidia down 5.76% premarket on a board investigation into its chief executive holding the Nasdaq-100 back (delayed CME quotes, via SwingFolio).
- On completed bars the grade is unchanged after two bounce days: SPY closed Friday at $735.34, up 0.32% (StockAnalysis), its $742.21 high never reached the former window low at $750.36, and this morning's $741.94 premarket print (Finnhub, unfinished) sits below that first overhead line as well.
- Options learning point: the week's risk is dated, not vague — Tuesday's October CPI at 8:30am ET is the last inflation print before the Dec 9 Fed decision, with December hike pricing near 78–79%, so any premium sold today must survive that release inside an unrepaired frame, while waiting puts no option premium at risk.
Read the full brief and sources
- There is no 8:30am ET release to lead today — the site's economic calendar lists no release for Monday — so the morning is a positioning session in front of tomorrow's inflation print. Index futures rose at 7:20am ET: Dow futures up 0.95%, S&P 500 futures up 0.59% at 7,446 and Nasdaq-100 futures up 0.47% at 27,212 (delayed CME contract quotes, via SwingFolio). The split inside that rise matters: Nvidia fell 5.76% in premarket at 7:33am ET after its board opened an independent investigation into chief executive Jensen Huang (SwingFolio premarket movers), which is why the Nasdaq-100 contract trails the Dow this morning — the bounce is broad, but its biggest single name is a drag, not a leader. SPY (the S&P 500 ETF) traded at $741.94 in premarket at 8:41am ET, up 0.90% (Finnhub, unfinished), and the VIX sat near 23 after closing Friday at 25.64 (CAMS morning brief) — calmer, still elevated. Today's dated items are light: September wholesale trade at 10:00am ET and the New York Fed's October Survey of Consumer Expectations at 11:00am ET (morning coverage calendars).
- Start with the widest frame, on completed daily bars. The completed Sep 28–Nov 6 window for SPY (the S&P 500 ETF) runs from $781.62 (the Oct 6 high) down to $732.71 (Thursday's intraday low). Friday's completed bar opened at $734.82, reached $742.21, fell to $734.58 and closed at $735.34, up 0.32% (StockAnalysis daily bars, completed bar), on 57.8 million shares — less than half Thursday's 125.9 million. Behind the ETF, the S&P 500 index closed at 7,376.86, up 0.31%, the Nasdaq Composite rose 1.09% to 24,579.42 and the Dow Jones Industrial Average fell 0.46% to 51,285.73 (Friday closing prints). QQQ (the Nasdaq-100 ETF) closed at $656.10, up 1.40% (Finnhub regular-session close). Participation improved from Thursday's washout but stayed split: 183 S&P 500 members advanced and 316 declined at Friday's close, while 63% of members sat above their own 50-day average (ChartRow, Nov 6 close) — the index rose on a minority of its members.
- Grade the bounce against the stack it has to climb, in the order a recovery would meet the lines: the former window low at $750.36 (the Oct 30 intraday low) is first, then the thin shelf at $758.68–$758.79 (the Oct 23 and Oct 1 lows, two touches), the old range low at $760.64 (the Oct 16 low), the zone at $764.25–$766.71 (the Oct 14, Oct 15, Oct 19 and Oct 20 lows, four touches), and the shelf at $775.14–$775.95 (the Oct 9 and Oct 13 lows, two touches). Friday's session high of $742.21 stopped $8.15 short of $750.36, so the first overhead line was never tested, and this morning's premarket print at $741.94 (Finnhub, unfinished) sits below it as well. Two bounce days in, the grade is unchanged: no repair, because repair starts with a completed close back above $750.36 — and no new break either, because Friday's close held above Thursday's $732.71 low. Overnight, Asia joined the bounce: Japan's Nikkei 225 surged about 3.3% to above 59,300 and South Korea's Kospi gained about 1.4%, while Hong Kong's Hang Seng edged higher (investingLive Asia wrap); gold rose about 1.3% to near $4,130 an ounce, Brent crude sat near $96.70–$98 a barrel and bitcoin slipped about 1.3% to just below $75,000 (investingLive) — context, not a grade: none of it moves a single completed US bar.
- Rates are holding their post-jobs level while the market waits for the one print that can move them. The 10-year Treasury yield rose 0.9 basis points to 4.869% on Monday morning (Tradeweb, via Morningstar's Dow Jones briefing at 6:14am ET), essentially where Friday left it after the jobs report. December hike pricing is likewise little changed: a tracker applying the CME FedWatch method put the implied odds of a 25bp hike at 78.9% at 6:30am ET today, against the 78% Reuters reported after Friday's data — snapshots differ by source, the level does not. Tomorrow is the test: the October CPI report lands Tuesday at 8:30am ET (BLS), the last inflation report before the Dec 9 Fed decision, and it comes with a quirk — BLS never collected October 2025 prices during the shutdown, so no 12-month change will be published for the headline or core index; the monthly change is the whole story, with forecasts running from the Cleveland Fed nowcast's +0.24% headline and +0.21% core to RBC's +0.3% for both (CPI preview, PipTheory). Retail sentiment cannot grade any of this yet: the latest AAII survey (bullish 34.1%, bearish 48.4%, week ended Nov 4) closed before Thursday's break and Friday's bounce.
- This morning's BMO earnings, verified from official releases: Constellation Energy (CEG) reported GAAP net income of $5.19 per share, or $5.06 adjusted, on revenue of $9.55 billion and raised the midpoint of its full-year adjusted guidance to $12.50–$12.80 (company release). KKR reported GAAP diluted EPS of $1.19, or $1.78 per adjusted share, with assets under management at about $804 billion (posted Q3 materials, via Dow Jones and Reuters). NRG Energy reported GAAP EPS — basic, as the release states it — of $2.59, or $4.68 adjusted, and reaffirmed 2026 guidance (Business Wire release). Ferguson reported GAAP diluted EPS of $3.08, or $3.43 adjusted, on sales of $9.03 billion (Business Wire release), and monday.com reported GAAP diluted EPS of $0.80, or $2.14 non-GAAP, on revenue of $377.5 million, up 19% (company release). The rest of today's 62-name BMO slate stays in the site's earnings checks as pending, not silently dropped. Tonight's after-hours reports — including Occidental Petroleum and Take-Two Interactive — come after today's 4:00pm ET close, so they cannot grade today's session; they are separate, later evidence.
Analyst interpretation: two bounce days have changed the mood and none of the levels. Friday's close held Thursday's low, which stops the break from extending, but the bounce ran on less than half of Thursday's volume, most S&P 500 members still fell, and neither Friday's high nor this morning's premarket trade has reached the first overhead line at $750.36. That is relief inside a broken frame, not repair — and through a conservative put-seller's lens the calendar, not the bounce, is the binding constraint: Tuesday's CPI is a monthly-only print this time (no 12-month figure exists, because October 2025 prices were never collected), forecasts for the monthly core change sit between +0.21% and +0.3%, and December hike pricing near 78–79% says the market has largely decided what a hot print means. A hypothetical teaching example only — not a market quote and not a trade: in the Options Industry Council's terms, a put credit spread sells one put and buys a lower-strike put with the same expiry; sold for a hypothetical $1.25 credit on a $5-wide spread, its maximum gain is $1.25, its maximum loss is $3.75 plus fees, and its breakeven is the short strike minus $1.25. If the underlying expires between the strikes with the spread worth $2.00, the loss is $0.75 before fees — the full $3.75 is lost only at or below the long strike — and the short put carries assignment risk before expiry. A larger credit is not a higher win rate; the breakeven condition is what has to hold, and a spread sold today would have to hold it through tomorrow's 8:30am ET release. Waiting puts no option premium at risk; its cost is possibly missing further recovery, not a spread loss. A research question to study, not a recommendation: after a closing break of a multi-week window low, compare how often the second bounce day's close reclaiming the broken floor within the week predicted a durable repair, against how often the bounce faded first when a dated inflation print sat in between. With no 8:30am release today and the week's main print tomorrow, waiting is a valid position.
A completed close back above $750.36 — the Oct 30 intraday low that served as the window low until Thursday — held on a later retest of that line from above would be the first repair evidence after the false break; a later completed close above $758.79, the top of the $758.68–$758.79 shelf built from the Oct 23 and Oct 1 lows, would extend the repair toward the old range low at $760.64 and the zone at $764.25–$766.71.
A completed close below $732.71, Thursday's intraday low and the current window low, would extend the break, with no completed-bar shelf inside the Sep 28–Nov 6 window below it; a bounce that stalls under $750.36 and closes back below $735.34, Friday's completed close, would show the broken floor still governing the frame.
Sources
- SPY daily bars (open/high/low/close, volume) through Nov 6: Nov 6 open $734.82, high $742.21, low $734.58, close $735.34, +0.32%, volume 57.8 million — StockAnalysisNov 6, 2026, 4:00pm ET close (completed bars through Nov 6)
- SPY premarket price $741.94, up 0.90%, at 8:41am ET Nov 9 (unfinished) — FinnhubNov 9, 2026, 8:41am ET
- QQQ regular-session close $656.10, up 1.40% on Nov 6 — FinnhubNov 6, 2026 regular-session close
- Premarket Nov 9 at 7:20am ET: Dow futures +0.95%, S&P 500 futures +0.59% at 7,446, Nasdaq futures +0.47% at 27,212; Nvidia -5.76% at 7:33am ET after its board opened an investigation into CEO Jensen Huang; S&P 500 fell 2.68% last week — SwingFolio US pre-market (EODHD/Yahoo Finance data, may be delayed)Nov 9, 2026, 7:20am ET
- Morning brief Nov 9: Dow futures up about 0.9%, S&P 500 futures up 0.5%, Nasdaq 100 futures up 0.2%; 10-year Treasury yield near 4.85%; VIX near 23 after Friday's 25.64 close; September wholesale trade due 10:00am ET, New York Fed consumer expectations survey at 11:00am ET; CPI Tuesday 8:30am ET — CAMS Morning Market BriefNov 9, 2026, morning ET
- North American morning briefing: 10-year Treasury yield rose 0.9 basis points to 4.869% (Tradeweb); Nvidia slides premarket on the Huang probe — Morningstar (Dow Jones)Nov 9, 2026, 6:14am ET
- S&P 500 breadth at the Nov 6 close: 183 advancing, 316 declining; 63% of S&P 500 members above their own 50-day average — ChartRowNov 6, 2026, 4:00pm ET
- Asia-Pacific wrap Nov 9: Nikkei 225 surged about 3.3% to above 59,300, Kospi gained about 1.4%, Hang Seng edged higher; Brent dipped to about $96.70 and WTI briefly below $90 before recovering; gold rose about 1.3% to near $4,130; bitcoin slipped about 1.3% to just below $75,000 — investingLiveNov 9, 2026 (Asian session, published 4:19am UTC)
- December hike odds: CME fed funds futures implied probability of a 25bp hike 78.9% at 6:30am ET Nov 9 (Kalshi 76.5%, Polymarket 76.5% on the same board) — Prediction Markets Picks Fed rate tracker (CME FedWatch method)Nov 9, 2026, 6:30am ET
- October CPI preview: BLS releases Tuesday Nov 10 at 8:30am ET; no 12-month change will be published because October 2025 prices were never collected during the shutdown; monthly forecasts from the Cleveland Fed nowcast (+0.24% headline, +0.21% core) to RBC (+0.3% for both); last CPI before the Dec 8-9 Fed decision — PipTheory (BLS schedule, Cleveland Fed, RBC)Nov 10, 2026 release preview (checked Nov 9, 2026)
- AAII Sentiment Survey, week ended Nov 4, 2026: bullish 34.1%, neutral 17.5%, bearish 48.4% — AAII (survey closed before the Nov 5 session)Nov 5, 2026 (survey week ended Nov 4, 2026)
- Constellation Energy Q3 2026: GAAP net income $5.19 per share, adjusted (non-GAAP) operating earnings $5.06 per share, revenues $9,550 million; full-year adjusted guidance raised at the midpoint and narrowed to $12.50-$12.80 — Constellation Energy (official release)Nov 9, 2026
- KKR Q3 2026: adjusted net income jumped 29% to $1.6 billion, or $1.78 per share, beating the $1.59 LSEG average estimate; $25 billion raised in the quarter, assets under management above $800 billion; fee-related earnings up 27% to $1.3 billion — ReutersNov 9, 2026
- KKR Q3 2026: profit of $1.12 billion, or $1.19 a share (GAAP), vs $859.9 million, or $0.90, a year earlier; adjusted EPS $1.78 vs $1.58 FactSet estimates; fee-related earnings $1.32 billion; revenue $4.56 billion — Morningstar (Dow Jones)Nov 9, 2026, 7:54am ET
- NRG Energy Q3 2026: GAAP net income $561 million, GAAP EPS - basic $2.59, adjusted EPS $4.68, adjusted EBITDA $2,013 million; 2026 guidance reaffirmed, 2027 guidance initiated — Business Wire (official release)Nov 9, 2026, 6:51am ET
- Ferguson quarter ended Sep 30, 2026: net sales $9,026 million (+9.5%); reported diluted EPS $3.08, adjusted diluted EPS $3.43; adjusted operating profit $962 million — Business Wire (official release, via 6ix)Nov 9, 2026, 6:46am ET
- monday.com Q3 2026: revenue $377.5 million (+19%); GAAP operating income $31.2 million and GAAP diluted EPS $0.80; non-GAAP operating income $89.4 million; operating cash flow fell to $20.4 million from $95.1 million; Q4 revenue forecast $380-$382 million — company release, via JBizNewsNov 9, 2026
- Week ahead Nov 9-13: Monday earnings include Constellation Energy, KKR, Occidental Petroleum and Take-Two Interactive; Wednesday is Veterans Day with the Treasury market closed; Friday brings October PPI — Independent Investor week aheadWeek of Nov 9-13, 2026