
Daily brief · 2026-11-06
Historical edition · New York time. These observations reflect their published date, not current market conditions.
Payrolls blow past forecasts — a bounce meets a firmer hike case
false break, day one below: payrolls +165k firmed the hike pricing while futures bounce inside a broken frame — today's close grades it
Chart analysis
Published chart · Tap chart to enlarge.
Published chart lesson
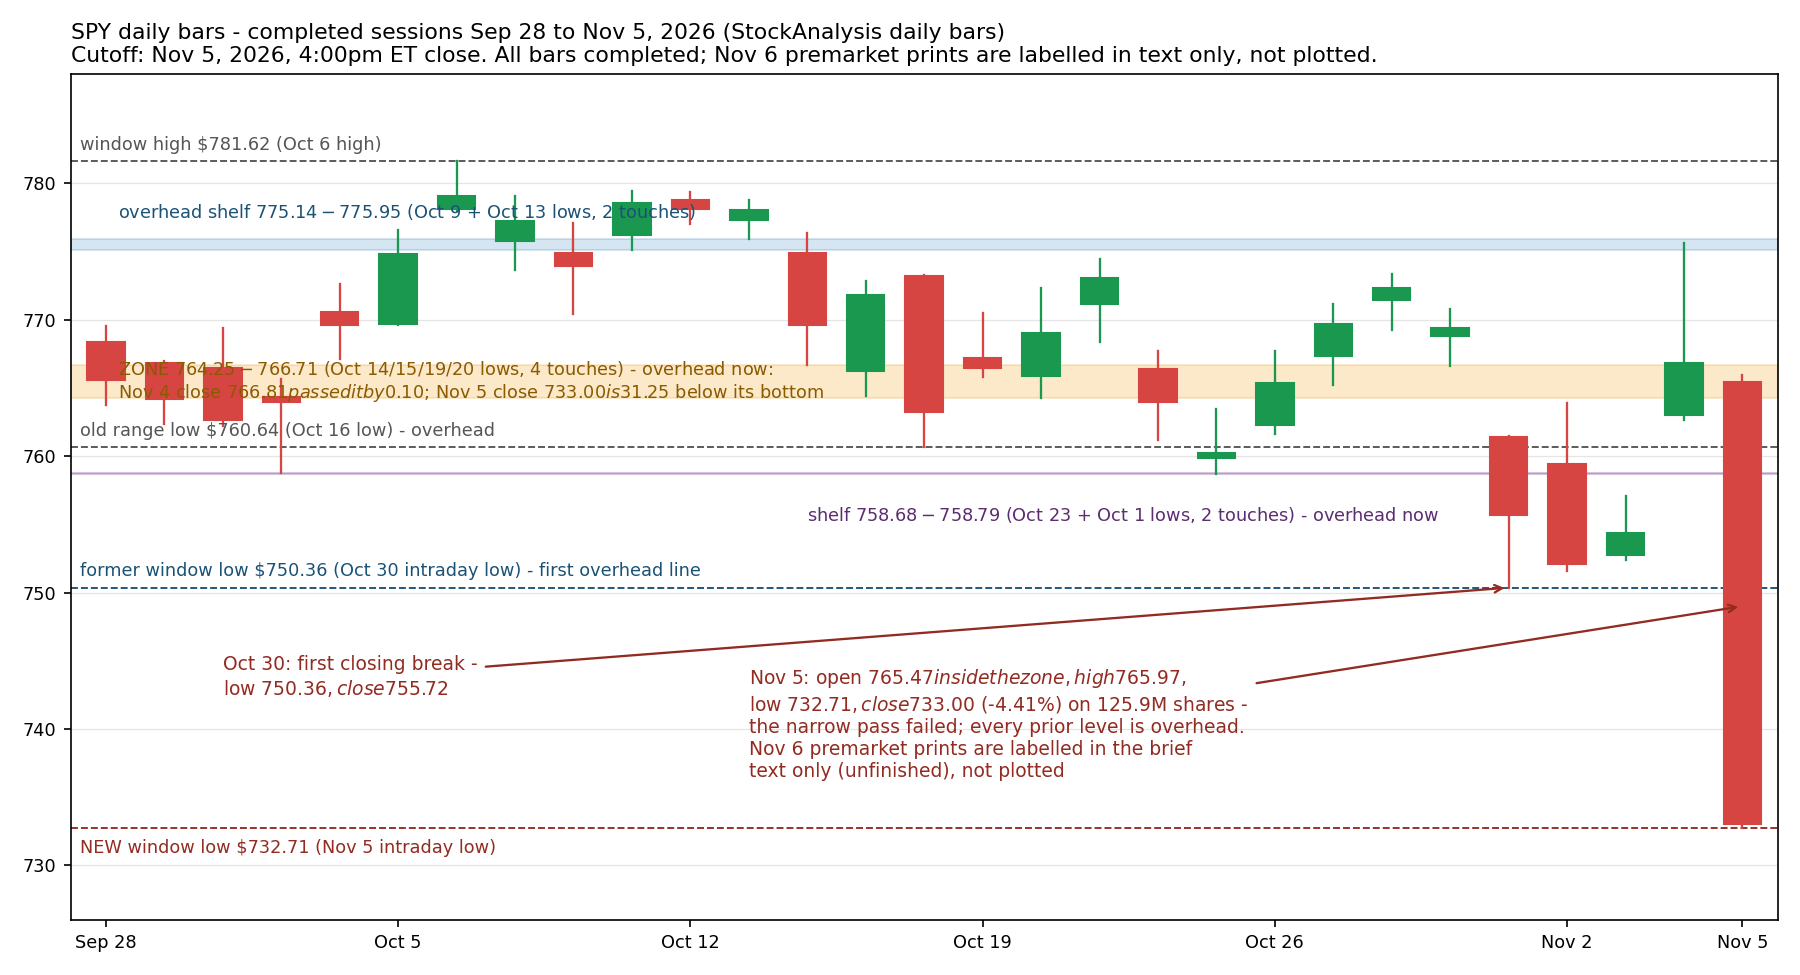
A level broken on a completed close changes sides: what was support becomes the first overhead test. SPY's former window low is $750.36, the Oct 30 intraday low (StockAnalysis daily bars); it held as the window's floor through Nov 4, and Thursday's completed bar closed at $733.00, below it, after setting a new low of $732.71. This morning's premarket trade ($735.01 at 7:00am ET, unfinished) sits below $750.36 as well, so the bounce so far is trading underneath the broken floor, not reclaiming it — a bounce under a broken level is not a retest of support, and it is not established support either. What would weaken the lesson: a completed close back above $750.36, then a retest of that line from above that holds, would show the level working from the other side and start the repair grade; a completed close below $732.71 would extend the break instead and leave the lesson intact.
Brief analysis source: SPY daily, StockAnalysis, Nov 5 2026 . Chart uses its own dated Yahoo series; vendor levels can differ.
Three key points
- The October jobs report landed hot the morning after the crash: payrolls rose 165,000 against a 65,000 Reuters-poll forecast, unemployment slipped to 4.1%, wages rose 0.4% on the month, and the prior two months were revised up by a combined 84,000 (BLS, via Reuters).
- Thursday's completed bars graded Wednesday's narrow pass a false break: SPY closed at $733.00, down 4.41% (StockAnalysis), with a new window low at $732.71, the former window low at $750.36 now the first overhead line, and only 71 S&P 500 members advancing against 431 decliners (CappNotes).
- Options learning point: a strong print into a broken frame stacks event risk — December hike pricing firmed after the release (CME FedWatch readings from 70% to more than 76%) with October CPI due Tuesday, so any premium sold now must survive both prints, while waiting puts no option premium at risk.
Read the full brief and sources
- The 8:30am ET jobs report landed hot, one morning after the crash. Nonfarm payrolls rose 165,000 in October, far above the 65,000 forecast in the Reuters poll, and the unemployment rate slipped to 4.1% from 4.2% (Bureau of Labor Statistics, via Reuters). Pay firmed too: average hourly earnings rose 0.4% on the month and 3.1% on the year, and the prior two months were revised up by a combined 84,000 — August up 53,000 to 186,000 and September up 31,000 to 60,000, from the 29,000 first reported (BLS figures, via Reuters and MarketWatch). The rate market answered first: the 10-year Treasury yield rose to 4.88% after the release, from 4.837% at Thursday's close (Investor's Business Daily live coverage; CNBC), and December hike pricing firmed through the morning — Investor's Business Daily put the odds at 70%, up from 67% on Thursday (CME FedWatch), while CNBC's Treasury coverage at about 8:49am ET put them at more than 76%, up from more than 66% the day before; the snapshots differ, the direction does not. One caution inside the report: this was the first release after the federal shutdown, collection was affected and the September household survey was not conducted (BLS) — a strong print on a noisier survey.
- Start with the widest frame, on completed daily bars. SPY (the S&P 500 ETF) on Thursday opened at $765.47, reached $765.97, fell to $732.71 and closed at $733.00, down 4.41% (StockAnalysis daily bars, completed bar), on 125.9 million shares — double Wednesday's 62.1 million. The completed Sep 28–Nov 5 window now runs from $781.62 (the Oct 6 high) down to a new low of $732.71 (Thursday's intraday low): Thursday's bar extended the window instead of testing its edge. Behind the ETF, the S&P 500 index closed at 7,353.73, down 4.36% (ChartExchange completed bar), the Dow fell 3.44% to 51,523.06 and the Nasdaq Composite fell 5.52%, into correction territory (closing recaps). QQQ (the Nasdaq-100 ETF) opened at $683.12, reached $683.65, fell to $647.05 and closed at $647.05, down 6.49% (StockAnalysis, completed bar) — closing exactly on its low. One housekeeping note: Thursday's postmarket brief, written on an earlier snapshot, carried SPY's close as $733.45 on 99.6 million shares; that published brief stays as written under the append-only rule, and today's grading uses the provider's current completed-bar figures.
- Grade the week against the tests the briefs set. Wednesday's close at $766.81 was a narrow pass — $0.10 above the top of the $764.25–$766.71 zone built from the Oct 14, Oct 15, Oct 19 and Oct 20 completed lows (four touches). Thursday's completed close at $733.00 sits below the zone's bottom, so the pass is graded a false break, and every level that acted as support is now overhead, in the order a recovery would meet them: the former window low at $750.36 (the Oct 30 intraday low), the thin shelf at $758.68–$758.79 (the Oct 23 and Oct 1 lows, two touches), the old range low at $760.64 (the Oct 16 low), the zone at $764.25–$766.71, and the shelf at $775.14–$775.95 (the Oct 9 and Oct 13 lows, two touches). Participation matched the price damage: only 71 S&P 500 members rose against 431 that fell at Thursday's close (CappNotes closing recap), and 32% of all US stocks sat above their 50-day average at that close (StocksSetups) — the broad base behind Wednesday's bounce narrowed again in a single session.
- This morning's bounce attempt is real, split and unfinished. SPY traded at $735.01 in premarket at 7:00am ET, up 0.27% (StockAnalysis, unfinished — that print predates the jobs report), and QQQ at $656.70 at 8:40am ET, up 1.49% (Finnhub, unfinished). After the release, index futures pointed the same split way: Nasdaq-100 futures up about 1.3%, S&P 500 futures up about 0.2% and Dow futures down about 0.9% (Investopedia, this morning), and the VIX eased to about 26.1 from Thursday's 28.18 close (Reuters, via The Retest). Overnight the rout travelled: Japan's Nikkei 225 fell 6.0% to 57,434.77 and South Korea's Kospi fell 6.0% to 5,059.69, Hong Kong's Hang Seng lost 1.3%, and Europe opened lower, with France's CAC 40 down 1.1%, Germany's DAX down 1.5% and Britain's FTSE 100 down 1.4% (Bloomberg, via The Private Banker). Brent crude added 1.4% to $99.73 a barrel in Asian trade (Associated Press), spot gold sat near $4,045 an ounce and bitcoin near $75,500 (NordFX morning wrap). None of this grades anything yet: the bounce trades far below the first overhead line at $750.36, and today's completed close is the first evidence. Retail sentiment cannot grade it either — the fresh AAII survey (bullish 34.1%, bearish 48.4%, week ended Nov 4) closed before Thursday's session, so it measures pre-crash pessimism, not the response to the crash.
- This morning's BMO earnings, verified from official releases: Moderna swung to GAAP diluted EPS of $0.38 on revenue of $1.31 billion, up 29%, and raised its full-year revenue growth outlook to 15–25% (ACCESS Newswire release). Humana reported GAAP EPS of $1.33, or a $0.70 adjusted loss per share, on revenues of $41,155 million and raised its full-year adjusted EPS guidance to at least $9.50 (Business Wire release). Enbridge reported GAAP earnings of C$0.59 per share, or C$0.49 adjusted — all figures in Canadian dollars — and reaffirmed its 2026 guidance (PR Newswire release). Brookfield Asset Management reported diluted EPS of $1.64, with distributable earnings of $0.47 per share (Globe Newswire release); PPL reported GAAP EPS of $0.49, or $0.54 on an ongoing basis (PR Newswire release). Charter swung to a GAAP loss of $20.50 per share, driven by a $6.3 billion noncash franchise impairment, on revenue of $14.92 billion (PR Newswire release), and Vistra reported GAAP net income of $1,140 million and raised its 2026 guidance, though its release states no per-share EPS figure (PR Newswire release). Today's full BMO slate is far larger than these headline names — the rest stays in the site's earnings checks as pending, not silently dropped.
Analyst interpretation: the jobs report removes one reading of Thursday and strengthens another. It argues against a growth scare — hiring beat forecasts by a wide margin, unemployment fell, and the two prior months were revised up — and Thursday's own evidence already pointed that way, with yields falling as stocks fell. What the print also does is remove the relief valve: with wages up 0.4% on the month and hike pricing firmer, the December meeting is now priced as a hike into a market whose structure broke yesterday on completed bars. This morning's bounce is led by the names that fell most (Nasdaq-100 futures up about 1.3% while Dow futures fell about 0.9%), which reads as relief inside a broken frame, not repair — repair is graded by completed closes against the overhead stack, starting with $750.36. A hypothetical teaching example only — not a market quote and not a trade: in the Options Industry Council's terms, a put credit spread sells one put and buys a lower-strike put with the same expiry; sold for a hypothetical $1.25 credit on a $5-wide spread, its maximum gain is $1.25, its maximum loss is $3.75 plus fees, and its breakeven is the short strike minus $1.25. If the underlying expires between the strikes with the spread worth $2.00, the loss is $0.75 before fees — the full $3.75 is lost only at or below the long strike — and the short put carries assignment risk before expiry. A larger credit is not a higher win rate; the breakeven condition is what has to hold, and between now and any near expiry sit today's close, Tuesday's CPI and the December meeting. Waiting puts no option premium at risk; its cost is possibly missing a further bounce, not a spread loss. A research question to study, not a recommendation: after one-day index falls of this size, compare how often the first completed close reclaimed the former window low within a week against how often a lower low came first — the answer, not one hot print, is what would change position sizing. With the frame broken and two dated prints ahead, waiting is a valid position.
A completed close back above $750.36 — the Oct 30 intraday low that served as the window low until Thursday — held on a later retest of that line from above would be the first repair evidence after the false break; a later completed close above $758.79, the top of the $758.68–$758.79 shelf built from the Oct 23 and Oct 1 lows, would extend the repair toward the old range low at $760.64 and the zone at $764.25–$766.71.
A completed close below $732.71, Thursday's intraday low and the current window low, would extend the break, with no completed-bar shelf inside the Sep 28–Nov 5 window below it; a bounce that stalls under $750.36 and closes back below $733.00, Thursday's completed close, would show the first overhead line still governing the frame.
Sources
- SPY daily bars (open/high/low/close, volume) through Nov 5 and Nov 6 premarket print $735.01 at 7:00am ET (unfinished) — StockAnalysisNov 5, 2026, 4:00pm ET close (completed bars through Nov 5); premarket Nov 6, 2026, 7:00am ET
- QQQ daily bars (open/high/low/close) — StockAnalysisNov 5, 2026, 4:00pm ET close (completed bars through Nov 5)
- QQQ premarket print $656.70, up 1.49% from the Nov 5 close — FinnhubNov 6, 2026, 8:40am ET
- S&P 500 index daily bar Nov 5: close 7,353.73, down 4.356% — ChartExchangeNov 5, 2026, 4:00pm ET close
- October jobs report: nonfarm payrolls +165,000 vs 65,000 forecast (Reuters poll); September revised up to 60,000 from 29,000; unemployment rate 4.1%, down from 4.2% — Reuters (Bureau of Labor Statistics)Nov 6, 2026, 8:30am ET release
- Jobs report card: payrolls +165,000 vs a 59,000 Wall Street Journal poll estimate; hourly wages posted the biggest increase in almost a year; August and September revised higher — MarketWatch (BLS)Nov 6, 2026, morning ET live coverage
- Live coverage: 10-year Treasury yield at 4.88% after trading at 4.87% just before 8:30am ET; markets pricing 70% odds of a 25bp hike on Dec 9, up from 67% on Thursday (CME FedWatch) — Investor's Business DailyNov 6, 2026, morning ET live coverage
- This morning: Nasdaq-100 futures up about 1.4%, S&P 500 futures up about 0.2%, Dow futures down about 0.9%; 10-year Treasury yield ticked up to 4.86%; bitcoin down more than 5% over 24 hours, recently around $76,000 — InvestopediaNov 6, 2026, morning ET
- Morning brief: Nasdaq-100 futures up 1.43% and the VIX at 26.07 on Friday morning (Reuters); jobs report expectations and the December hike debate — The RetestNov 6, 2026, morning ET
- Asia closes Nov 6: Nikkei 225 −6.0% at 57,434.77, Kospi −6.0% at 5,059.69, Hang Seng −1.3% at 24,481.86; Europe opened lower (CAC 40 −1.1%, DAX −1.5%, FTSE 100 −1.4%); Brent −0.93% at $97.38 in that wrap's later check — Bloomberg, via The Private BankerNov 6, 2026 (Asian session closes; Europe open)
- Asia trade: Nikkei midday −5.7%, Kospi morning −7.4%; Brent crude +1.4% at $99.73 and US crude +0.65% at $91.11 in Asian trading — Associated Press, via The Hindu BusinessLineNov 6, 2026 (Asian session)
- Morning wrap: Nikkei −6.14%, Kospi −6.06%, Hang Seng −1.08%; Brent about $99.8, gold about $4,045, bitcoin about $75,500 — NordFX Market PulseNov 6, 2026, morning ET
- S&P 500 breadth at the Nov 5 close: 71 gainers vs 431 decliners (14.1% advancing); Nasdaq Composite −5.52% to 24,315.00, in correction territory — CappNotes Closing LookNov 5, 2026 close
- AAII Sentiment Survey, week ended Nov 4, 2026: bullish 34.1%, neutral 17.5%, bearish 48.4% — AAII (survey closed before the Nov 5 session)Nov 5, 2026 (survey week ended Nov 4, 2026)
- Today's calendar: University of Michigan preliminary November sentiment at 10:00am ET, expected 48.0 — InvestingLive Morning KickstartNov 6, 2026, 8:00am ET
- Moderna Q3 2026: GAAP diluted EPS $0.38, total revenue $1.3 billion (+29%); full-year revenue growth outlook raised to 15–25% — ACCESS Newswire (official release, via Morningstar)Nov 6, 2026
- Humana Q3 2026: GAAP EPS $1.33, adjusted loss per share −$0.70, revenues $41,155 million; full-year adjusted EPS guidance raised to at least $9.50 — Business Wire (official release)Nov 6, 2026
- Enbridge Q3 2026: GAAP EPS C$0.59, adjusted EPS C$0.49 (Canadian dollars), adjusted EBITDA C$4.4 billion; 2026 guidance reaffirmed — PR Newswire (official release)Nov 6, 2026, 7:00am ET
- Brookfield Asset Management Q3 2026: net income attributable to BAM $1.64 per diluted share; distributable earnings $0.47 per share; fee-related earnings $0.54 per share — Globe Newswire (official release, via Morningstar)Nov 6, 2026
- PPL Q3 2026: reported (GAAP) EPS $0.49, ongoing EPS $0.54, revenues $2,497 million — PR Newswire (official release text)Nov 6, 2026
- Charter Q3 2026: GAAP diluted EPS −$20.50, net loss attributable to Charter shareholders $2,397 million, revenue $14.92 billion — PR Newswire (official release)Nov 6, 2026
- Vistra Q3 2026: GAAP net income $1,140 million, Ongoing Operations Adjusted EBITDA $2,378 million, 2026 guidance raised and narrowed — PR Newswire (official release; no per-share EPS stated in the release text)Nov 6, 2026, 7:00am ET