
Daily brief · 2026-11-02
Historical edition · New York time. These observations reflect their published date, not current market conditions.
Friday's close lost the zone — Monday's bounce meets ISM and Apple
bounce test from below a lost zone: futures green, yields steady — but Friday's close broke the structure, so today's close does the grading
Chart analysis
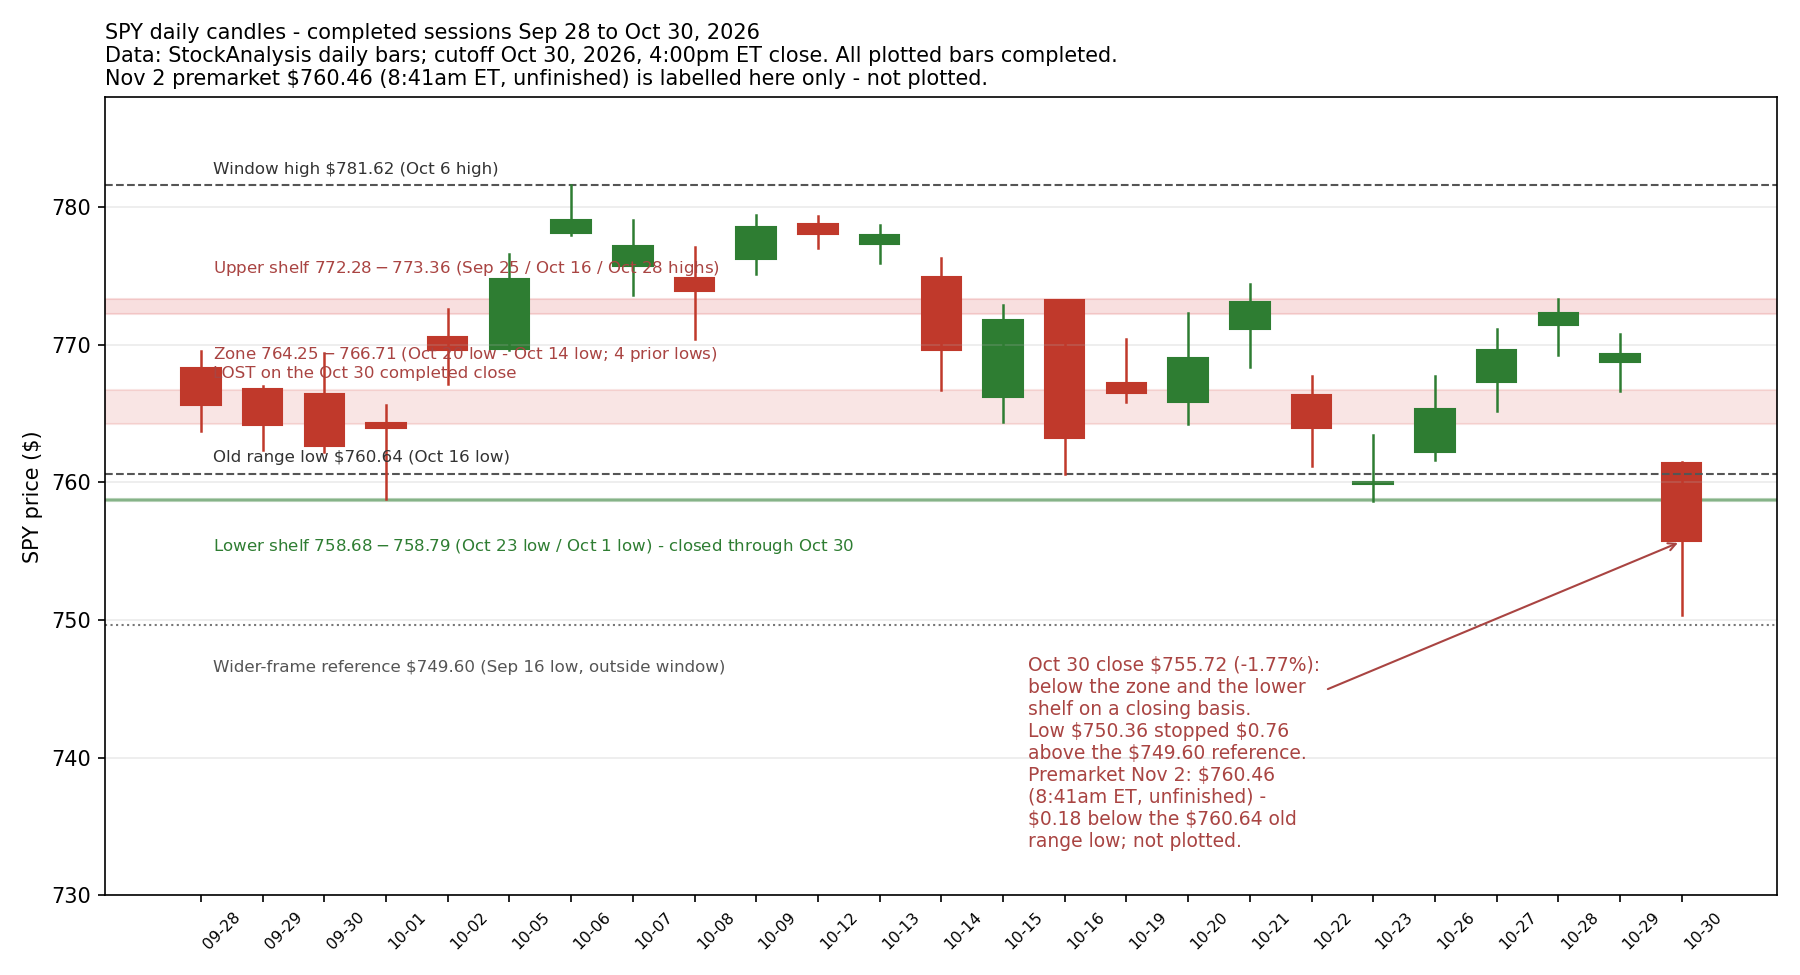
Published chart · Tap chart to enlarge.
Published chart lesson
A broken zone is retested from below, and the first bounce into its underside tests the break — it does not undo it. SPY's $764.25–$766.71 zone is built from four prior completed lows (StockAnalysis daily bars); Friday's completed bar closed at $755.72, below the whole zone, so on completed bars the zone is lost. This morning's premarket print of $760.46 (8:41am ET, unfinished) sits $0.18 below the $760.64 old range low (the Oct 16 low) and $3.79 below the zone's $764.25 bottom — the bounce has not yet reached the first level it would need to reclaim. What would weaken the lesson: a completed close back above $766.71, the zone top, followed by a retest of the zone from above that holds, would grade Friday's break as a false break; a completed close below $749.60, the Sep 16 low that Friday's low stopped $0.76 above, would instead extend the break to the wider frame.
Brief analysis source: SPY daily bars, StockAnalysis, Oct 30, 2026 (completed close); premarket print Nov 2, 2026, 8:41am ET (unfinished) . Chart uses its own dated Yahoo series; vendor levels can differ.
Three key points
- Friday's completed close broke the structure: SPY closed at $755.72, down 1.77% (StockAnalysis), below the $764.25–$766.71 zone (four prior lows) and through the $758.68–$758.79 lower shelf, with the day's low of $750.36 stopping $0.76 above the $749.60 Sep 16 reference.
- This morning is a bounce test, not a reclaim: SPY traded at $760.46 in premarket at 8:41am ET (unfinished), $0.18 below the $760.64 old range low and still below the zone, with the ISM manufacturing PMI at 10:00am ET (consensus 54.5–54.7 vs 54.5 prior) and Apple and Palantir reporting after tonight's close.
- Options learning point: a zone lost on a completed close is re-graded by the next completed close and a held retest, never by a premarket print — and any premium sold this week must survive midterm elections, JOLTS, ADP, jobless claims and Friday's jobs report, while waiting puts no option premium at risk.
Read the full brief and sources
- Start with the widest frame, on completed daily bars. SPY (the S&P 500 ETF) on Friday opened at $761.38, reached $761.46, fell to $750.36 and closed at $755.72, down 1.77% (StockAnalysis daily bars); the S&P 500 index itself closed at 7,580.07, down 1.82%. The completed Sep 28–Oct 30 window now runs from $781.62 (the Oct 6 high) down to $750.36 (Friday's intraday low), so Friday's close sits in the window's lower reaches, not its middle. The week that just completed (closes $765.37, $769.66, $772.31, $769.36, $755.72) finished down 0.6% against the Oct 23 close of $759.97, and October closed down 0.9% against Sep 30's $762.63. QQQ (the Nasdaq-100 ETF) closed Friday at $690.49, down 3.47% (completed bar) — the tech end of the tape fell roughly twice as hard as the broad index.
- Inside that frame, Friday's close broke the shelves the prior briefs were watching — on a closing basis, which is the basis that grades. The $764.25–$766.71 zone, built from four prior completed lows (Oct 14 at $766.71, Oct 15 at $764.43, Oct 19 at $765.82, Oct 20 at $764.25), is lost: the close finished $8.53 below its bottom. The thin lower shelf at $758.68–$758.79 (the Oct 23 and Oct 1 lows, two touches) was closed through as well. Friday's low of $750.36 stopped $0.76 above $749.60, the Sep 16 low — a wider-frame reference from before this window, not a level Friday tested and held. This morning SPY traded at $760.46 in premarket at 8:41am ET, up 0.63% (StockAnalysis, unfinished): above the lower shelf, $0.18 below the $760.64 old range low (the Oct 16 low), and still below the whole zone. QQQ traded at $697.78 at 8:42am ET, up 1.06% (unfinished). A premarket bounce grades nothing; today's completed close — above the zone, inside it, or still below $760.64 — is the evidence.
- There is no 8:30am ET release today — the site's economic calendar is empty at that slot — so the day's scheduled data test is the ISM manufacturing PMI at 10:00am ET, with consensus forecasts clustered at 54.5–54.7 against September's 54.5 (WSJ survey via Morningstar; Quantara Insights week-ahead), after the S&P Global final manufacturing PMI at 9:45am ET. Futures pointed higher this morning: S&P 500 futures up about 0.5%, Dow futures up about 0.5% and Nasdaq-100 futures up about 0.8% (Investopedia), and SPY's own premarket print was up 0.63%. The 10-year Treasury yield was 4.918% in European trade, down about 1bp (Morningstar/Dow Jones Newswires), against Friday's 4.93% close — steady, not a rescue. December hike pricing eased only slightly: CME FedWatch as of Nov 1 put a 25bp hike at the Dec 9 meeting at 69.8% (Growbeansprout), down from 71.4% on Oct 30, with other Nov 2 readings near 72% — a range in the high-60s to low-70s, not a regime change. Breadth narrowed as price broke: 61% of S&P 500 members closed Friday above their 50-day average, down 4.8 points on the day, with 61% above their 200-day average (StocksXray, Oct 30 close).
- Overnight, the selling did not spread. In Asia, South Korea's Kospi rose 2.2% to 5,859.08 and the Shanghai Composite gained 1.1% to 3,638.03, while Hong Kong's Hang Seng added 0.4% to 23,393.32 and Japan's Nikkei 225 slipped 0.3% to 63,081.86 (Associated Press). Brent crude fell 3.9% to $109.01 a barrel and US crude fell 4.1% to $99.82, back below $100, as reports of renewed US–Iran diplomacy circulated (AP); gold was up 0.4% to about $3,915 an ounce and bitcoin traded around $78,000 (Investopedia). Retail sentiment is context only this morning: the AAII survey published Thursday (week ended Oct 28) showed bullish 37.8% and bearish 41.4% — measured before Friday's break, so it cannot describe how investors feel after it.
- This morning's BMO earnings, verified from official releases, ran stronger than Friday's tape: Marriott reported GAAP diluted EPS of $3.04 and adjusted diluted EPS of $3.02 on revenues of $7,005 million (PR Newswire); IDEXX reported GAAP diluted EPS of $4.01 (Business Wire); Estée Lauder reported GAAP diluted EPS of $0.64 and adjusted EPS of $0.72 on net sales of $3,715 million and raised its full-year outlook (official release); Fox reported net income of $2.20 per share and adjusted EPS of $2.54 on revenue of $4,571 million, up 22% (official release); PSEG reported GAAP EPS of $0.76 and non-GAAP operating EPS of $1.15 (PR Newswire); Check Point reported GAAP diluted EPS of $1.82 and non-GAAP diluted EPS of $2.49 (PR Newswire); Entergy reported $1.98 on both a reported and an adjusted basis; Loews reported net income of $1.50 per share; CNA reported net income of $0.72 per share and core income of $0.75. Tower Semiconductor stays on the reconciliation queue rather than being recorded: wire summaries of its release conflict on EPS ($1.05 vs $1.15) and the GAAP-versus-adjusted split is not yet verified from the official text. A question to study, not a trade: this morning's verified beats sit in hotels, beauty, media and utilities — what would today's completed close and breadth have to show for that to count as the repair broadening beyond a premarket bounce?
Analyst interpretation: Friday's close changed the chart's grade, and this morning has not changed it back. The zone that held on Thursday's close was lost on Friday's, the lower shelf was closed through, and breadth narrowed to 61% above the 50-day average on the same day (StocksXray) — while the morning's bounce, at $760.46 premarket (unfinished), has not yet reached even the $760.64 old range low, let alone the zone's underside. The calendar argues for patience on its own: ISM at 10:00am ET today, Apple and Palantir after tonight's close, midterm elections and JOLTS on Tuesday, ADP and ISM services on Wednesday, jobless claims on Thursday and the October jobs report on Friday — five straight sessions of dated event risk into a Dec 9 Fed meeting the market still prices as a likely hike (69.8%, CME FedWatch as of Nov 1). A hypothetical teaching example only — not a market quote and not a trade: in the Options Industry Council's terms, a put credit spread sells one put and buys a lower-strike put with the same expiry; sold for a hypothetical $1.60 credit on a $10-wide spread, its maximum gain is $1.60, its maximum loss is $8.40 plus fees, and its breakeven is the short strike minus $1.60. If the underlying expires between the strikes with the spread worth $5.00, the loss is $3.40 before fees — the full $8.40 is lost only at or below the long strike — and the short put carries assignment risk before expiry. Waiting puts no option premium at risk; its cost is possibly missing a further move, not a spread loss. With the first close after a break still to come, waiting is a valid position.
A completed close back above $766.71, the zone top (the Oct 14 low), would grade Friday's closing break as a probe that failed — a narrow pass on its own; a later retest of the $764.25–$766.71 zone from above that holds would be stronger evidence. A completed close above $760.64, the old range low (the Oct 16 low), but still below the zone would be a weaker, partial step: the bounce holding its first reclaimed line without yet repairing the zone.
A completed close below $760.64, the old range low (the Oct 16 low), after this morning's premarket bounce reached $760.46 (unfinished) would grade the bounce as failed at its first test and keep Friday's break in force, with the already-closed-through $758.68–$758.79 shelf offering no closing-support claim. A completed close below $749.60, the Sep 16 low, would extend the break beyond the reference Friday's low stopped $0.76 above.
Sources
- SPY daily bars (open/high/low/close) and Nov 2 premarket print $760.46 at 8:41am ET (unfinished) — StockAnalysisOct 30, 2026, 4:00pm ET close (completed bars through Oct 30); premarket Nov 2, 2026, 8:41am ET
- QQQ daily bars and Nov 2 premarket print $697.78 at 8:42am ET (unfinished) — StockAnalysisOct 30, 2026, 4:00pm ET close (completed bars through Oct 30); premarket Nov 2, 2026, 8:42am ET
- Futures: S&P 500 +0.5%, Dow +0.5%, Nasdaq-100 +0.8%; WTI -4.5% back below $100; gold +0.4% to about $3,915; bitcoin around $78,000; Apple and Palantir report after today's close — InvestopediaNov 2, 2026, morning ET
- Asia: Kospi +2.2% to 5,859.08, Shanghai Composite +1.1% to 3,638.03, Hang Seng +0.4% to 23,393.32, Nikkei 225 -0.3% to 63,081.86; Brent -3.9% to $109.01, US crude -4.1% to $99.82 as US–Iran diplomacy reports circulated — Associated PressNov 2, 2026
- S&P 500 breadth at the Oct 30 close: 61% of members above their 50-day average (down 4.8 points on the day), 61% above their 200-day average — StocksXrayOct 30, 2026 close
- ISM manufacturing PMI today at 10:00am ET: WSJ survey consensus 54.5, prior (September) 54.5; S&P Global final manufacturing PMI at 9:45am ET — WSJ survey via Morningstar/Dow JonesOct 30, 2026
- Week ahead Nov 2–6, 2026: ISM manufacturing expected to rise to 54.7 from 54.5 in September; midterm elections Tuesday; October jobs report Friday — Quantara InsightsNov 2, 2026 (week-ahead preview)
- CME FedWatch as of Nov 1, 2026: 69.8% probability of a 25bp hike at the Dec 9, 2026 FOMC meeting — Growbeansprout (CME FedWatch)Nov 1, 2026
- AAII Sentiment Survey, week ended Oct 28, 2026: bullish 37.8%, bearish 41.4% — AAIIOct 29, 2026 (survey week ended Oct 28, 2026)
- Marriott Q3 2026: GAAP diluted EPS $3.04, adjusted diluted EPS $3.02, total revenues $7,005M — PR Newswire (official release)Nov 2, 2026
- IDEXX Q3 2026: GAAP diluted EPS $4.01, comparable EPS $3.96, revenues $1,214M — Business Wire (official release)Nov 2, 2026
- Estée Lauder fiscal Q1 2027: diluted EPS $0.64, adjusted diluted EPS $0.72, net sales $3,715M — official company release (Business Wire)Nov 2, 2026
- Fox fiscal Q1 2027: net income $957M, $2.20 per share, adjusted EPS $2.54, revenues $4,571M — official company releaseNov 2, 2026
- PSEG Q3 2026: net income EPS $0.76, non-GAAP operating EPS $1.15 — PR Newswire (official release, via Quantisnow)Nov 2, 2026
- Check Point Q3 2026: GAAP diluted EPS $1.82, non-GAAP diluted EPS $2.49, revenues $670M — PR Newswire (official release)Nov 2, 2026
- Entergy Q3 2026: as-reported EPS $1.98 and adjusted (non-GAAP) EPS $1.98 — PR Newswire (official release, via Morningstar)Nov 2, 2026
- Loews Q3 2026: net income $306M, $1.50 per share — PR Newswire (official release)Nov 2, 2026
- CNA Financial Q3 2026: net income $0.72 per share, core income $0.75 per share — PR Newswire (official release, via Morningstar)Nov 2, 2026
The bounce never reached the zone: SPY closes $751.83 and the break holds
break still in force: the bounce stopped $0.39 under the lost zone, close back below $760.64 — elections Tuesday, payrolls Friday
Chart analysis
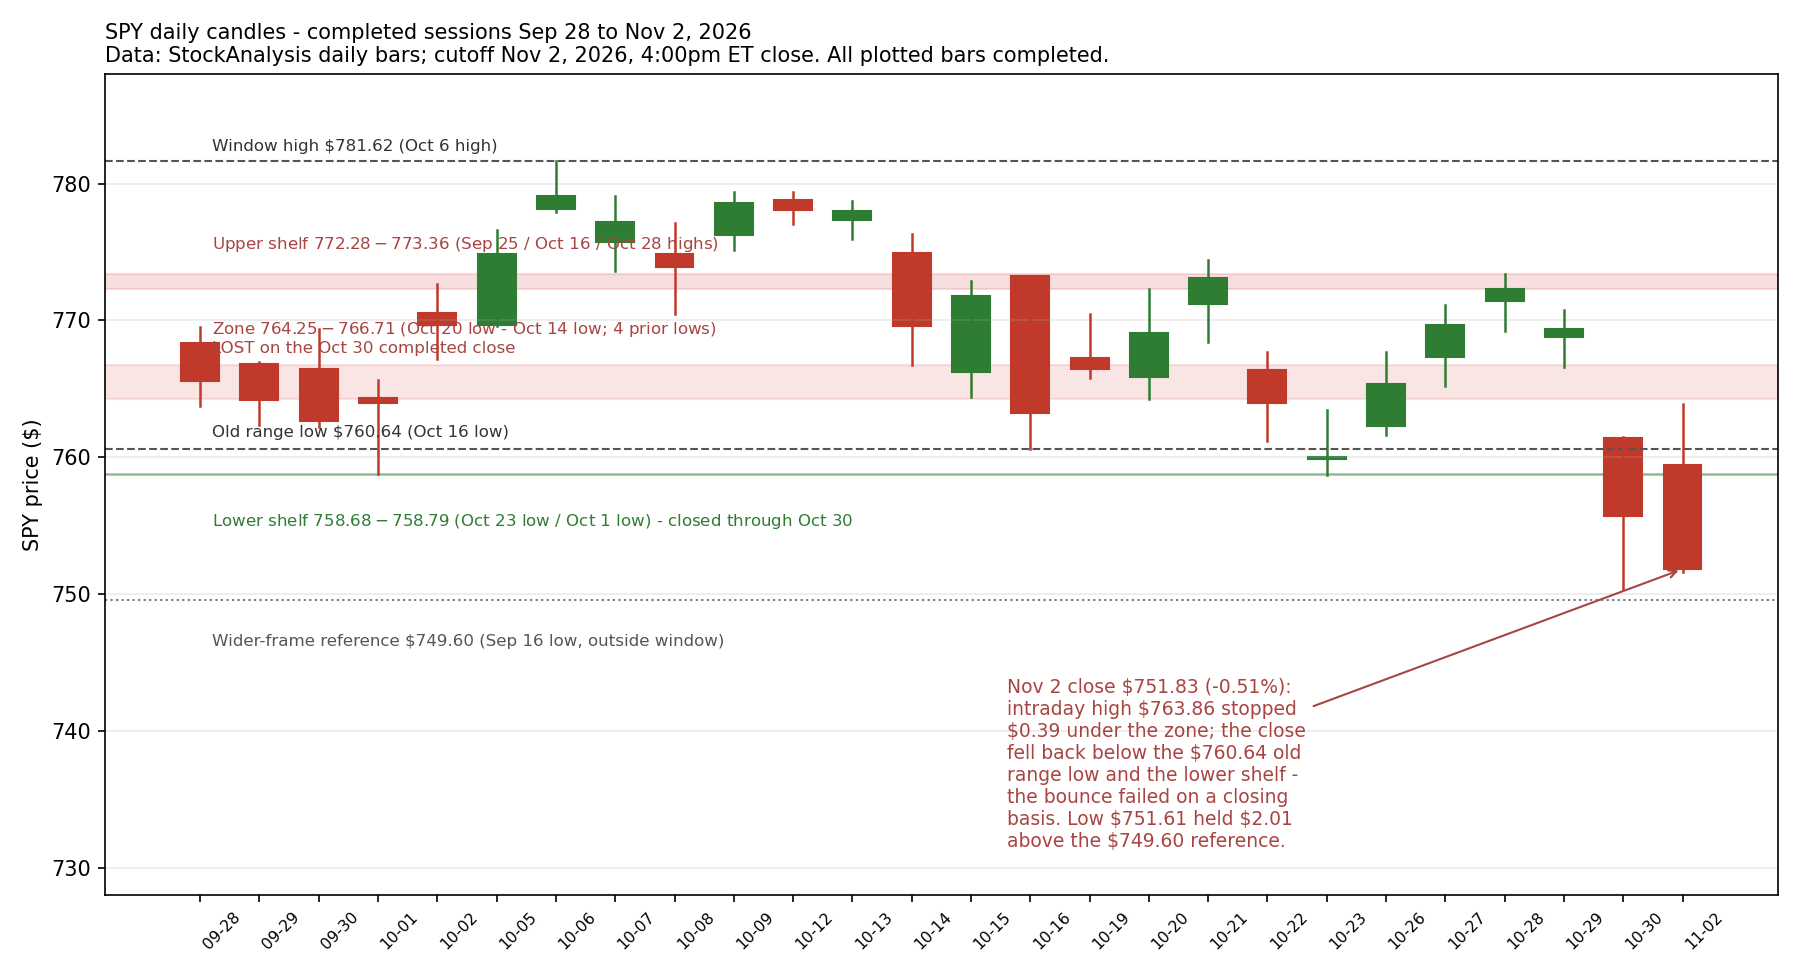
Published chart · Tap chart to enlarge.
Published chart lesson
A retest is graded by the completed close, not by the intraday high. SPY's $764.25–$766.71 zone is built from four prior completed lows (StockAnalysis daily bars): Friday's completed bar closed below it at $755.72, and today's completed bar reached $763.86 intraday — $0.39 below the zone's bottom — before closing at $751.83, back below the $760.64 old range low (the Oct 16 low) and the $758.68–$758.79 lower shelf. An intraday push that never enters the zone, followed by a close back below the first broken line, grades as a failed retest attempt: the break stays in force, and the intraday high is evidence about where sellers defended, not evidence of a recovery. The day's $751.61 low stopping $2.01 above the Sep 16 low of $749.60 is an observation, not established support. What would weaken the lesson: a completed close back above $766.71, the zone top (the Oct 14 low), followed by a retest from above that holds, would grade the break as reversed; a completed close below $749.60 would instead extend it into the wider frame.
Brief analysis source: SPY daily bars, StockAnalysis, Nov 2, 2026 (completed close) . Chart uses its own dated Yahoo series; vendor levels can differ.
Three key points
- SPY closed at $751.83, down 0.51% (StockAnalysis, completed bar): the intraday high of $763.86 stopped $0.39 below the $764.25–$766.71 zone and the close fell back below the $760.64 old range low, so Friday's closing break remains in force; the $751.61 low held $2.01 above the Sep 16 low of $749.60.
- ISM manufacturing beat at 55.5 (ISM, via PR Newswire) even as the S&P 500 index fell 0.5% and the Nasdaq Composite 1.1% (Investopedia closing recap) — and after the close Apple beat with EPS of $2.10 on revenue of $114.5 billion while Palantir reported revenue of $2,313 million, up 96% (official releases).
- Options learning point: an intraday bounce that never reaches the lost zone and closes back below the first broken line grades as a failed retest, not a recovery — grading waits for the completed close, and any premium sold now must survive Tuesday's midterm elections and Friday's jobs report, while waiting puts no option premium at risk.
Read the full brief and sources
- Start with the widest frame, on completed daily bars. SPY (the S&P 500 ETF) today opened at $759.45, reached $763.86, fell to $751.61 and closed at $751.83, down 0.51% (StockAnalysis daily bars, completed bar), on volume of about 43.9 million shares — well below Friday's roughly 76.7 million. The completed Sep 28–Nov 2 window still runs from $781.62 (the Oct 6 high) down to $750.36 (Friday's intraday low): today's close sits about 3.8% below the window high and below every shelf that window built. QQQ (the Nasdaq-100 ETF) opened at $695.32, reached $699.43, fell to $681.14 and closed at $681.20, down 1.35% (completed bar) — a close below Friday's $683.45 low, so the growth side made a new closing low rather than steadying. The 16:00 ET close grades today's tests only: tonight's Apple and Palantir reports came after it and are a separate, later development, graded first by Tuesday's session.
- Inside that frame, the morning's test was graded in full — and the bounce failed it. The premarket brief set three closing outcomes: back above the $764.25–$766.71 zone (built from four prior lows — Oct 20, Oct 15, Oct 19 and Oct 14), inside it, or still below the $760.64 old range low (the Oct 16 low). The intraday high of $763.86 stopped $0.39 below the zone's $764.25 bottom, so the bounce never entered the zone even intraday, and the completed close of $751.83 is below all three markers: $8.81 below the old range low and back below the thin lower shelf at $758.68–$758.79 (the Oct 23 and Oct 1 lows, two touches). Friday's closing break therefore remains in force, now with a failed intraday retest attempt on top of it — graded, not final: no session has yet rallied into the broken levels and held above any of them. The day's low of $751.61 stopped $2.01 above $749.60, the Sep 16 low — a wider-frame reference from before the plotted window, an observation, not established support. Breadth: the latest published StocksXray reading at this check was still Friday's — 61% of S&P 500 members above their 50-day average and 61% above their 200-day average as of Oct 30 — no Nov 2 breadth figure had been published, so no fresh breadth claim is made here.
- The index scoreboard split by size and sector. The Dow Jones Industrial Average rose 0.4% while the S&P 500 index fell 0.5% and the Nasdaq Composite fell 1.1% (Investopedia closing recap) — index figures, not ETF prices. Early gains faded in the afternoon as the AI and chip names came under pressure again (Investopedia): the S&P 500 technology index fell 2.7% and the chip ETF SOXX about 4%, with Intel down 9% after Friday's roughly 30% fall, Marvell down 13% on news it is buying Lumentum in a deal valuing it at $115 billion, AMD down 7% and Micron down 6%. Energy fell 4% as oil plunged, while airlines rose on the cheaper fuel — United up 5%, American and Delta up 4% — and Sherwin-Williams rose 6% to lead the Dow (Investopedia). IWM, the Russell 2000 ETF, was $280.25, up 0.33%, in a late-session print (StockAnalysis, as of 3:19pm ET — an ETF price, not the index level). The morning's firm tone coincided with a stronger-than-expected ISM print rather than following from any single headline this brief can prove.
- The day's data beat while rates and oil pulled opposite ways. The ISM manufacturing PMI rose to 55.5 in October from 54.5 in September, ahead of the roughly 54.6 consensus, with production at 59.0 — its highest since November 2021 — new orders at 55.5 and employment back in expansion at 52.4, while prices paid eased to 75.2 from 77.9 but stayed high (ISM report, via PR Newswire; Reuters). The 10-year Treasury yield was 4.92% around the close after an intraday low of 4.87%, its lowest since early September (Investopedia). WTI crude was recently down 8% at $95.80 a barrel (Investopedia) — the day's biggest macro move, and the backdrop to energy's 4% fall and the airlines' rise. Gold futures rose 1.5% to $3,955 an ounce and bitcoin was trading at $76,700, down from an intraday high near $78,500 (Investopedia); ether traded near $2,290 on Nov 2, up 0.67% (crypto.news).
- Earnings reconciliation, and tonight's reports. The postmarket pass verified 8 more results from dated official releases, taking the earnings file to 475 verified rows — 30 of them dated Nov 2 — including Apple, Palantir, Vertex, onsemi, Clorox and Realty Income. Apple (after the close, so after today's grading) reported fiscal Q4 diluted EPS of $2.10 on revenue of $114.5 billion, up 12% — ahead of the $1.99 consensus and above its own revenue guidance of +9–11%, with gross margin of 47.9% inside the guided 47–48% range (Apple release). Palantir reported Q3 revenue of $2,313 million, up 96%, well above its $2,160–$2,164 million guidance, with GAAP and adjusted EPS both $0.44 in the official release (Business Wire; Reuters); Palantir was roughly flat in the first after-hours prints (Finnhub snapshot, 4:29pm ET) — an unfinished after-hours read, not a grade — and Apple's report landed at the end of the window, so both names get their first full-session grade on Tuesday. Not recorded, and carried forward: Diamondback's adjusted EPS of $5.86 (Reuters) with its GAAP figure not verified from the official text, Tower Semiconductor's conflicting wire EPS figures, and Roku, SBA Communications, Neurocrine, Grab and BioMarin, which had not produced a verified official release by this check. A question to study, not a trade: with the break un-repaired and a stacked event calendar, what would Tuesday's bar need to show — a close back above $760.64, or a rally into $758.68–$760.64 that fails — to change today's grade?
Analyst interpretation: two completed closes now sit below the zone, the old range low and the lower shelf, and today's intraday attempt to repair the break stopped $0.39 short of even entering the zone — on lighter volume than Friday's break. That grades Friday's move as still in force, while the close also sits just $2.23 above the wider-frame $749.60 reference, so the next shelf of evidence is close in both directions. The calendar argues against hurry: midterm elections on Tuesday, AMD on Tuesday night, Qualcomm and Arm on Wednesday night, jobless claims on Thursday and the October jobs report on Friday, with Apple and Palantir still to get their first full-session grade. A hypothetical teaching example only — not a market quote and not a trade: a $5-wide put credit spread (sell one put, buy a lower-strike put with the same expiry, in the Options Industry Council's definition) sold for a hypothetical $0.85 credit has a maximum gain of $0.85, a maximum loss of $4.15 plus fees, and a breakeven at the short strike minus $0.85. If the underlying finishes between the strikes at expiry with the spread worth $2.50, the loss is $1.65 before fees — the full $4.15 is lost only at or below the long strike — and the short put carries assignment risk before expiry. Waiting puts no option premium at risk; its cost is possibly missing a further move, not a spread loss. No edge today — sitting out is also a position.
A session that rallies into the $758.68–$760.64 area — the broken lower shelf and old range low — and then closes back below $758.68, the shelf's bottom (the Oct 23 low), would grade Friday's break as accepted on a held retest, stronger evidence than two closes alone. A completed close below $749.60, the Sep 16 low, would extend the break into the wider frame and remove the last nearby reference the bounce has been leaning on.
A completed close back above $760.64, the old range low (the Oct 16 low), would start grading the two closes below it as a probe rather than an accepted break; a completed close back above $766.71, the zone top (the Oct 14 low), followed by a retest from above that holds, would complete the reversal and put the $764.25–$766.71 zone back in play as the frame's centre.
Opened positions today — two opening orders were filled and recorded in the activity log; no names, strikes, sizes or values are stated here.
Sources
- SPY daily bars (open/high/low/close), completed through Nov 2 — StockAnalysisNov 2, 2026, 4:00pm ET close (completed bars through Nov 2)
- QQQ daily bars (open/high/low/close), completed through Nov 2 — StockAnalysisNov 2, 2026, 4:00pm ET close (completed bars through Nov 2)
- Closing recap: Dow +0.4%, S&P 500 index -0.5%, Nasdaq Composite -1.1%; early gains faded as tech fell (S&P tech index -2.7%, SOXX about -4%, Intel -9%, Marvell -13% on the Lumentum deal, AMD -7%, Micron -6%); energy -4% as WTI fell 8% to $95.80; airlines up (United +5%); 10-year yield 4.92% after a 4.87% intraday low; gold futures +1.5% to $3,955; bitcoin $76,700 — InvestopediaNov 2, 2026, after the close (recap crawled ~4:24pm ET)
- ISM Manufacturing PMI at 55.5 in October 2026 (from 54.5 in September): production 59.0, new orders 55.5, employment 52.4, prices paid 75.2 — Institute for Supply Management, via PR Newswire / MorningstarNov 2, 2026, 10:00am ET release
- US manufacturing picks up in October, input prices stay high (ISM 55.5 vs about 54.6 consensus) — Reuters, via KitcoNov 2, 2026
- Breadth: 61% of S&P 500 members above their 50-day average and 61% above their 200-day average — latest published reading, as of the Oct 30 close (no Nov 2 figure published at this check) — StocksXray market breadthReading as of Oct 30, 2026 close; page checked Nov 2, 2026, ~4:31pm ET
- Apple fiscal Q4 2026 official release: revenue $114.5 billion (+12%), diluted EPS $2.10 (+14%, including a +$0.05 tariff-refund benefit), gross margin 47.9% — Apple, carried by MacDailyNewsNov 2, 2026, after the close
- Palantir Q3 2026: revenue $2,313 million (+96%) tops estimates, full-year guidance raised — Reuters (GAAP and adjusted EPS of $0.44 each per the official Business Wire release)Nov 2, 2026, after the close
- Vertex Q3 2026 official release: revenue $3.44 billion (+12%), GAAP diluted EPS $2.56, non-GAAP diluted EPS $4.76 — Business WireNov 2, 2026 (official release)
- onsemi Q3 2026 official release: revenue $1,722 million (+11%), GAAP diluted EPS $0.79, non-GAAP diluted EPS $0.90 — GlobeNewswireNov 2, 2026 (official release)
- Clorox fiscal Q1 2027 official release: net sales $1.91 billion (+33%), GAAP diluted EPS $1.39, adjusted EPS $1.55 — PR NewswireNov 2, 2026 (official release)
- Realty Income Q3 2026 official release: net income $0.43 per share; AFFO $1.12 per share (REIT AFFO, not EPS) — PR NewswireNov 2, 2026 (official release)
- Diamondback Energy Q3 2026: adjusted EPS $5.86 beats the $5.46 LSEG estimate (GAAP figure not verified from the official text at this check) — ReutersNov 2, 2026
- Ether traded near $2,290 on November 2, up 0.67% — crypto.newsNov 2, 2026