
Daily brief · 2026-10-30
Historical edition · New York time. These observations reflect their published date, not current market conditions.
ECI lands in line, tech rout deepens — SPY premarket slips below the zone
zone test from below at the open: ECI +0.8% in line, December hike odds eased to 71.4%, Nasdaq futures down about 2.3%
Chart analysis
Published chart · Tap chart to enlarge.
Published chart lesson
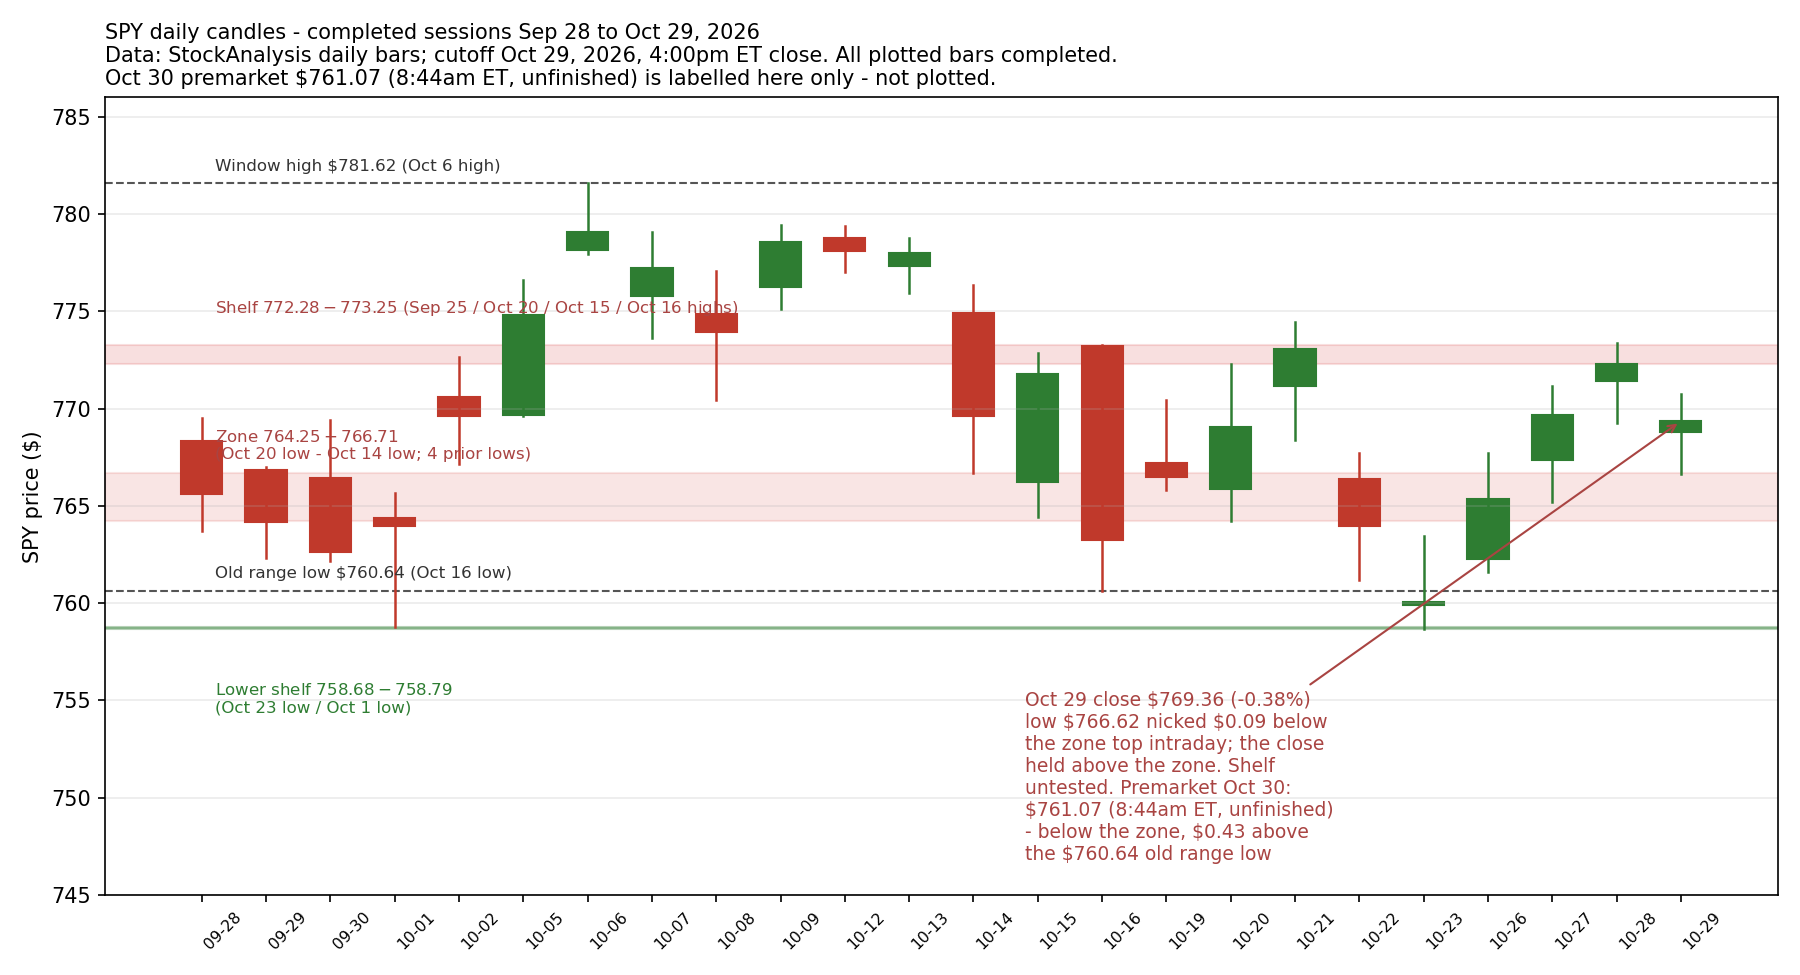
A premarket print below a zone is not a closing break of it. SPY's $764.25-$766.71 zone is built from four prior completed lows (StockAnalysis daily bars): Thursday's completed bar dipped to $766.62 — $0.09 below the $766.71 zone top (the Oct 14 low) — and closed at $769.36, above the whole zone, so on completed bars the zone held. This morning's premarket print of $761.07 (8:44am ET, unfinished) sits below the zone's $764.25 bottom and $0.43 above the $760.64 old range low (the Oct 16 low), but an unfinished print grades nothing: the same tape that nicked the zone top on Thursday and recovered can move again before 4:00pm ET. What would weaken the lesson: a completed close below $760.64 would grade the zone as lost on a closing basis, and a completed close back above $766.71 would grade this morning's dip as a probe that failed.
Brief analysis source: SPY daily bars, StockAnalysis, Oct 29, 2026 (completed close); premarket print Oct 30, 2026, 8:44am ET (unfinished) . Chart uses its own dated Yahoo series; vendor levels can differ.
Three key points
- The 8:30am ET data landed on plan: Q3 Employment Cost Index rose 0.8% on the quarter, exactly as expected and down from Q2's 0.9%, with wages up 0.7% (BLS via Seeking Alpha) — while December hike pricing eased to 71.4% (CME FedWatch readings dated Oct 30) and Nasdaq-100 futures still fell about 2.3% on the Amazon and Intel reactions (Invezz).
- On completed bars, SPY closed Thursday at $769.36, down 0.38% (StockAnalysis) — above the $764.25-$766.71 zone after a $0.09 intraday nick of its top — and traded at $761.07 in premarket at 8:44am ET (unfinished): below the zone, $0.43 above the $760.64 old range low, with Friday's completed close still to grade the test and complete the weekly bar.
- Options learning point: a premarket gap through a zone is not a closing break of it — grading waits for the completed close — and any premium sold today must survive a month-end Friday session plus Apple on Monday night, while waiting puts no option premium at risk.
Read the full brief and sources
- The 8:30am ET release leads, and it removes an excuse for the morning's fall rather than adding one. The Q3 Employment Cost Index rose 0.8% on the quarter, exactly matching the 0.8% consensus (WSJ survey, via Morningstar) and easing from Q2's 0.9%; wages and salaries rose 0.7%, down from 0.9%, and benefit costs rose 0.9%, down from 1.0% (Bureau of Labor Statistics, via Seeking Alpha). Wage costs cooling on schedule did not rescue futures, because the selling is earnings-led: Nasdaq-100 futures fell about 2.3%, S&P 500 futures about 1.0% and Dow futures were little changed (Invezz; Investopedia) while Amazon fell about 7% and Intel about 25% in premarket trading after last night's reports. December hike pricing actually eased — CME FedWatch readings dated Oct 30 put a 25bp hike at 71.4%, down from the 83% reading on Thursday morning, with an Oct 29 evening reading of 74.9% in between (Benzinga, via Longbridge; CME FedWatch) — and the 10-year Treasury yield was 4.911% in the early snapshot (Barron's). The data say 'on plan'; the tape says 'tech repricing'. Chicago PMI follows at 9:45am ET.
- Start with the widest frame, on completed daily bars. SPY (the S&P 500 ETF) on Thursday opened at $768.79, reached $770.76, held a low of $766.62 and closed at $769.36, down 0.38% (StockAnalysis daily bars) — the first down close after three straight gains. The completed Sep 28-Oct 29 window still runs from $781.62 (the Oct 6 high) down to $758.68 (the Oct 23 low), so Thursday's close sits about 1.6% below the window high, near the middle of the range. On the weekly frame, this week's four completed closes are $765.37, $769.66, $772.31 and $769.36; the week is unfinished — only Friday's close completes it, and Friday also closes the month. QQQ (the Nasdaq-100 ETF) closed Thursday at $715.34, down 1.42% (completed bar) — still above its Oct 23 low of $701.16, and still well below its own Oct 6 window high of $762.86.
- Inside that frame, this morning's unfinished prints point at the underside of the structure — and grade nothing until the close. SPY traded at $761.07 in premarket at 8:44am ET, down 1.08% (StockAnalysis, unfinished): below the whole $764.25-$766.71 zone (built from four prior lows — Oct 20, Oct 15, Oct 19 and Oct 14) that held on Thursday's completed close, and just $0.43 above the $760.64 old range low (the Oct 16 low). Below that sits the thin lower shelf at $758.68-$758.79 (the Oct 23 and Oct 1 lows, two touches). QQQ traded at $696.50 at 8:43am ET, down 2.63% (StockAnalysis, unfinished) — below its own Oct 23 low of $701.16. A premarket print is not a close: today, Friday's completed close does all the grading at once — back above the zone, inside it, or below the old range low — and it completes the weekly bar at the same time.
- Participation and the overnight tape say the pressure is broad abroad and still concentrated at home. The latest published S&P 500 breadth figure at this check is still Monday's: 60.8% of members above their 50-day average (Market Scholars, Oct 26); no newer update had been verified by the 8:45am ET check, so no fresher breadth claim is made here. The AAII survey published Thursday (week ended Oct 28) showed pessimism easing but still elevated — bullish 37.8%, bearish 41.4% against a 31.5% historical average (AAII Sentiment Survey) — and that survey week largely predates the Fed decision and this week's data. Overnight, Japan's Nikkei fell 2.12% and China's Shanghai Composite fell 1.44%, while Europe's STOXX 600 was down 0.17% and the FTSE 100 up 0.31% (Barron's); the Bank of Japan held its policy rate at 1.25% in an 8-1 vote (TradingView News). In the same Barron's snapshot, Brent crude futures were up 2.42% and gold futures down 1.19%, and bitcoin fell back below $80,000 — as low as $76,000 in Asian trading — while reports of a security incident at Binance weighed on crypto-linked shares (Investopedia; TradingView News).
- This morning's BMO earnings, verified from official releases, were led by the oil majors — and energy was the morning's offset to tech. ExxonMobil reported GAAP EPS of $3.72 and adjusted EPS of $4.23 (Business Wire), and Chevron reported GAAP diluted EPS of $5.06 and adjusted diluted EPS of $5.28 on total revenues of $67.8 billion (Business Wire); both beat expectations as refining margins surged, and their shares rose about 2% and 1% in premarket trading (Reuters). AbbVie reported GAAP diluted EPS of $2.37 and adjusted diluted EPS of $3.82 on net revenues of $17.4 billion (PR Newswire); Regeneron reported GAAP diluted EPS of $18.45 and non-GAAP diluted EPS of $20.07 on total revenues of $5.1 billion, up 36% (GlobeNewswire); AstraZeneca reported EPS of $2.02 and core EPS of $2.79 on total revenue of $16.2 billion (Business Wire); Colgate-Palmolive reported GAAP EPS of $0.94 and Base Business EPS of $0.97 on net sales of $5.37 billion and raised its margin and Base Business EPS guidance (Business Wire); General Dynamics reported diluted EPS of $4.49 on revenue of $14.6 billion, with no adjusted EPS presented (PR Newswire). The rest of today's 47-name BMO slate, and the carried names whose official releases state no EPS figure (Haleon's trading statement, NextDecade's business update, Televisa's BMV filing), stay on the reconciliation queue rather than being guessed. A question to study, not a trade: energy and health care delivered verified beats on the same morning tech is being repriced — what evidence in Friday's completed close would show that offset broadening, rather than staying inside two sectors?
Analyst interpretation: the morning separates cleanly into a data story that behaved and an earnings story that did not. The ECI matched the plan (+0.8%), December hike pricing eased to 71.4%, and the 10-year yield sits below 5% — yet futures point well lower because three nights of big-tech reports have repriced AI spending, not because the wage data surprised anyone. On completed bars the chart has not changed its grade yet: Thursday's close held above the $764.25-$766.71 zone, and the premarket print at $761.07 (unfinished) is a warning, not a verdict. Through a conservative put-seller's lens, this is the calendar at its thickest — a month-end Friday close that also completes the weekly bar, Chicago PMI at 9:45am ET, and Apple waiting on Monday night. A hypothetical teaching example only — not a market quote and not a trade: a $10-wide put credit spread (sell one put, buy a lower-strike put with the same expiry, in the Options Industry Council's definition) sold for a hypothetical $1.85 credit has a maximum gain of $1.85, a maximum loss of $8.15 plus fees, and a breakeven at the short strike minus $1.85. If the underlying finishes between the strikes at expiry with the spread worth $4.50, the loss is $2.65 before fees — the full $8.15 is lost only at or below the long strike — and the short put carries assignment risk before expiry. Waiting puts no option premium at risk; its cost is possibly missing a further move, not a spread loss. With the close grading everything at once today, waiting is a valid position.
A completed close back above $766.71, the zone top (the Oct 14 low), would grade this morning's premarket dip as a probe that failed and keep Thursday's zone-hold reading intact — a narrow pass on its own; a completed close above $764.25, the zone bottom (the Oct 20 low), but inside the zone would be weaker evidence, a close within the zone rather than above it. A completed close that also holds above $760.64, the old range low (the Oct 16 low), on a day when Nasdaq-100 futures fell about 2.3% would separately show the selling staying name-specific rather than structural.
A completed close below $760.64, the old range low (the Oct 16 low), would grade the $764.25-$766.71 zone as lost on a closing basis and reopen the thin $758.68-$758.79 lower shelf (the Oct 23 and Oct 1 lows) as the next test; a completed close inside the zone, between $764.25 and $766.71, would start that grading without completing it.
Sources
- SPY daily bars (open/high/low/close) and Oct 30 premarket print $761.07 at 8:44am ET (unfinished) — StockAnalysisOct 29, 2026, 4:00pm ET close (completed bars through Oct 29); premarket Oct 30, 2026, 8:44am ET
- QQQ daily bars and Oct 30 premarket print $696.50 at 8:43am ET (unfinished) — StockAnalysisOct 29, 2026, 4:00pm ET close (completed bars through Oct 29); premarket Oct 30, 2026, 8:43am ET
- Q3 Employment Cost Index +0.8% q/q vs +0.8% consensus and +0.9% in Q2; wages +0.7%, benefits +0.9% — Seeking Alpha (BLS data)Oct 30, 2026, 8:33am ET
- ECI consensus +0.8% and Chicago PMI at 9:45am ET (consensus 56.0) — WSJ survey via Morningstar/Dow JonesOct 29, 2026, 10:14am ET
- Nasdaq-100 futures -2.33%, S&P 500 futures -1.04%, Dow futures +0.03%; Amazon -7.2% and Intel about -25% premarket — InvezzOct 30, 2026, 7:06am ET
- Nasdaq futures pointing 2.4% lower, S&P 500 futures down 1%, Dow futures marginally higher; Brent above $113, gold below $4,000; bitcoin back below $80,000 on Binance incident reports — InvestopediaOct 30, 2026, morning ET
- Premarket snapshot: S&P 500 futures down 1.05%, Dow futures up 0.12%, 10-year yield 4.911%, Brent futures up 2.42%, gold futures down 1.19%; Nikkei -2.12%, Shanghai -1.44%, STOXX 600 -0.17%, FTSE 100 +0.31% — Barron'sOct 30, 2026, morning ET (about two hours before the open)
- CME FedWatch: 71.4% probability of a 25bp hike at the Dec 9, 2026 meeting — Benzinga via LongbridgeOct 30, 2026, 7:56am UTC (3:56am ET)
- AAII Sentiment Survey, week ended Oct 28, 2026: bullish 37.8%, neutral 20.7%, bearish 41.4% — AAIIOct 29, 2026 (survey week ended Oct 28, 2026)
- S&P 500 breadth: 60.8% of members above their 50-day average at Monday's close — the latest published reading at this check — Market ScholarsOct 26, 2026 close
- Bank of Japan held its policy rate at 1.25% (8-1 vote); bitcoin as low as $76,000 in Asian trading — TradingView News (Reuters/Seeking Alpha summary)Oct 30, 2026, 5:49am UTC (1:49am ET)
- ExxonMobil Q3 2026: GAAP EPS $3.72, adjusted EPS $4.23 — Business Wire (official release)Oct 30, 2026
- Chevron Q3 2026: GAAP diluted EPS $5.06, adjusted diluted EPS $5.28, total revenues $67.8B — Business Wire (official release)Oct 30, 2026
- Exxon and Chevron both beat expectations on refining margins; Exxon shares +2% and Chevron +1% premarket — Reuters via SRN NewsOct 30, 2026, 6:38am ET
- AbbVie Q3 2026: GAAP diluted EPS $2.37, adjusted diluted EPS $3.82, net revenues $17.4B — PR Newswire (official release)Oct 30, 2026
- Regeneron Q3 2026: GAAP diluted EPS $18.45, non-GAAP diluted EPS $20.07, total revenues $5.1B — GlobeNewswire (official release, via Morningstar)Oct 30, 2026
- AstraZeneca 9M and Q3 2026: reported EPS $2.02, core EPS $2.79, total revenue $16.2B — Business Wire (official release)Oct 30, 2026
- Colgate-Palmolive Q3 2026: GAAP EPS $0.94, Base Business EPS $0.97, net sales $5.37B, guidance raised — Business Wire (official release)Oct 30, 2026
- General Dynamics Q3 2026: diluted EPS $4.49, revenue $14.6B — PR Newswire (official release)Oct 30, 2026
- Next sessions: Apple fiscal Q4 after the close Mon Nov 2, 2026 (call 5:00pm ET); ISM manufacturing Nov 2 at 10:00am ET — MarketBeat / Moomoo calendar reportsWeek of Nov 2, 2026 (checked Oct 30, 2026)
Zone lost on the close: SPY falls 1.77% as Intel and Reddit drop about 29%
closing break, not a probe: SPY closed below the zone, the old range low and the lower shelf — tech-led rout, 10Y eased to 4.93%
Chart analysis
Published chart · Tap chart to enlarge.
Published chart lesson
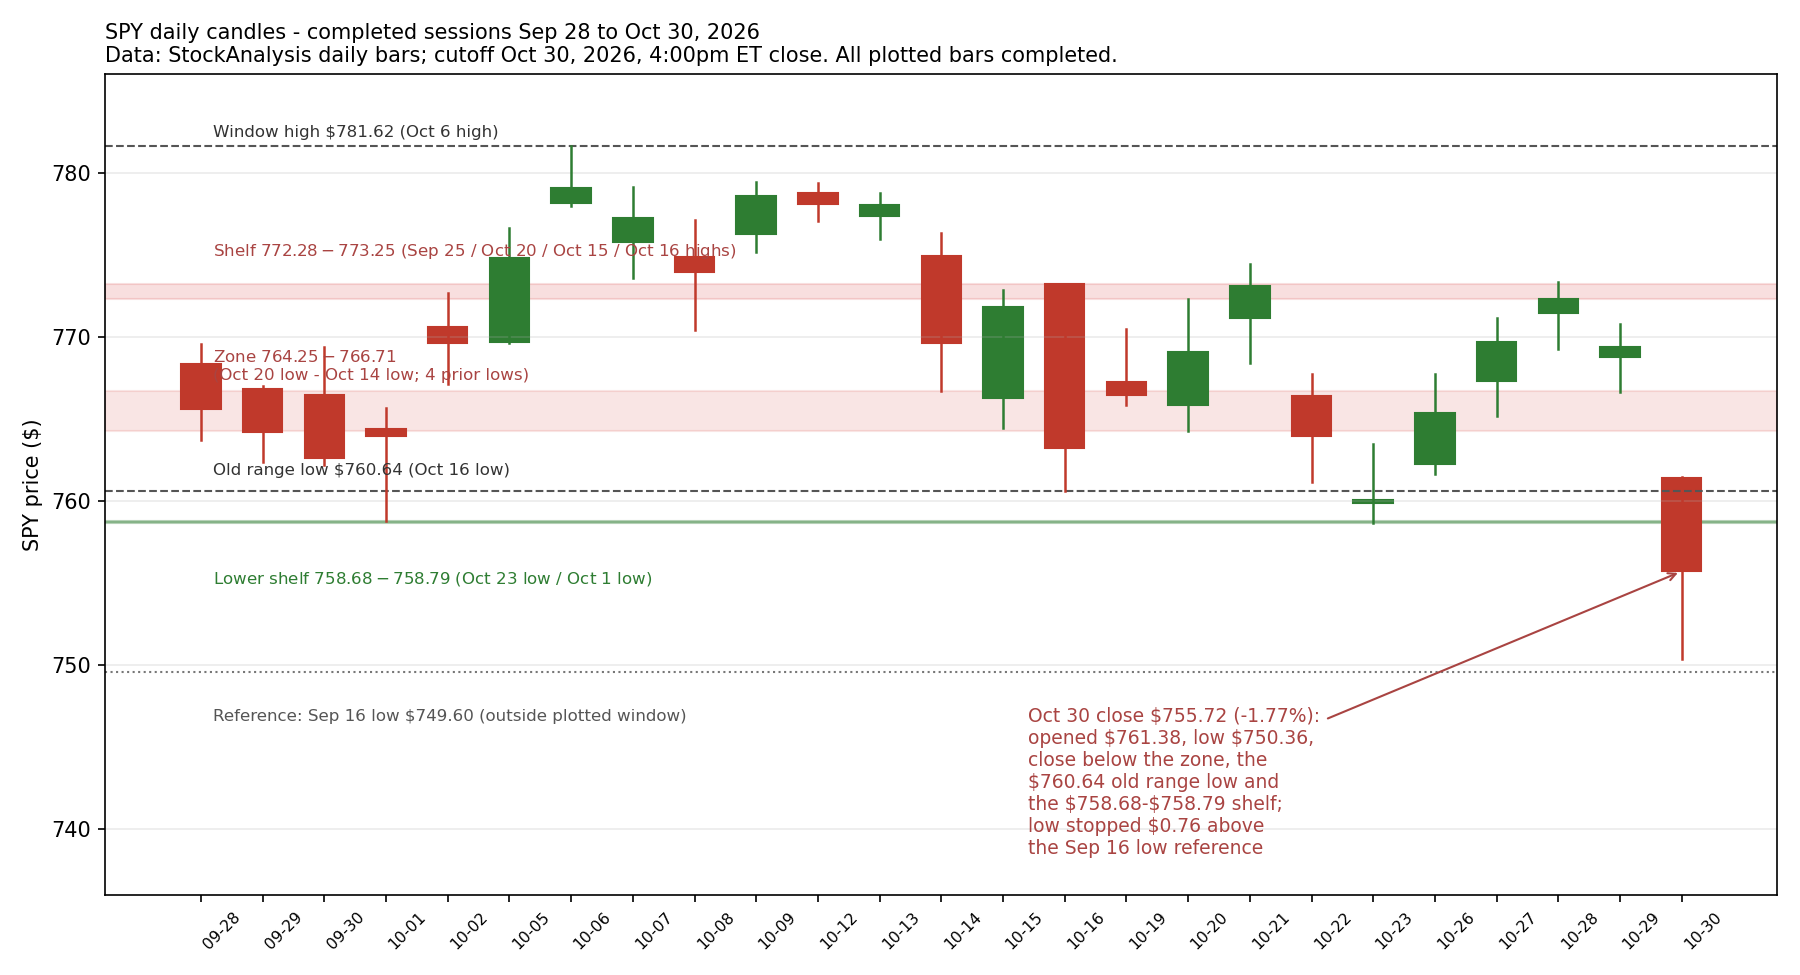
A completed close below a zone grades the zone as lost — and one close is only the first grade, not the final one. SPY's $764.25–$766.71 zone is built from four prior completed lows (StockAnalysis daily bars): SPY closed above it for four straight sessions (Oct 26–29), then today's completed bar opened at $761.38 — already below the zone — and closed at $755.72, below the zone's $764.25 bottom, the $760.64 old range low (the Oct 16 low) and the $758.68–$758.79 lower shelf. That is a closing break, graded narrowly: confirmation in this method is graded, so a later session that rallies into the broken shelf and closes back below it would be the held-retest evidence that strengthens the break, while the intraday low of $750.36 stopping $0.76 above the Sep 16 low of $749.60 is an observation, not established support. What would weaken the lesson: a completed close back above $758.79, the shelf top (the Oct 1 low), would start grading today's close as a one-day probe below the shelf, and a completed close back above $766.71, the zone top, would complete that reversal of the grade.
Brief analysis source: SPY daily bars, StockAnalysis, Oct 30, 2026 (completed close) . Chart uses its own dated Yahoo series; vendor levels can differ.
Three key points
- SPY closed Friday at $755.72, down 1.77% (StockAnalysis, completed bar): below the $764.25–$766.71 zone, the $760.64 old range low and the $758.68–$758.79 lower shelf — the zone is graded lost on a closing basis, and the day's $750.36 low stopped $0.76 above the Sep 16 low of $749.60.
- The S&P 500 index fell 1.8%, the Nasdaq Composite 2.9% and the Dow 1.1% (Associated Press closing recap), with Intel down 28.6% and Reddit down 29.2% (Finnhub) while ExxonMobil rose 2.16% and Chevron 1.75% — and the 10-year Treasury yield eased to 4.93% (AP).
- Options learning point: four closes above a zone can still be followed by a close below it — grading waits for completed closes, not intraday probes — and any premium sold now must survive Apple and Palantir on Monday night, while waiting puts no option premium at risk.
Read the full brief and sources
- Start with the widest frame, on completed daily bars. SPY (the S&P 500 ETF) on Friday opened at $761.38, reached $761.46, fell to $750.36 and closed at $755.72, down 1.77% (StockAnalysis daily bars, completed bar), on volume of about 76.7 million shares against about 40.3 million on Thursday. The completed Sep 28–Oct 30 window now runs from $781.62 (the Oct 6 high) down to $750.36 — today's intraday low extended the window's low, which had been $758.68 (the Oct 23 low) — so the close sits about 3.3% below the window high and below every shelf the window had built. The weekly bar is now complete: this week's five closes are $765.37, $769.66, $772.31, $769.36 and $755.72, a week down about 0.6% from last Friday's $759.97 close, and October itself closes down about 0.9% from September 30's $762.63 close (completed bars). QQQ (the Nasdaq-100 ETF) closed at $690.49, down 3.47% (completed bar), with a low of $683.45 — below its Oct 23 low of $701.16. The 16:00 ET close grades today's tests only: tonight's small-cap after-hours reports are a separate, later development, and Monday's session is their first closing grade.
- Inside that frame, the morning's test was graded in full — and the zone failed it on a closing basis. The premarket brief set three closing outcomes: back above the $764.25–$766.71 zone (built from four prior lows — Oct 20, Oct 15, Oct 19 and Oct 14), inside it, or below the $760.64 old range low (the Oct 16 low). The completed close of $755.72 is below all three markers: $8.53 below the zone's $764.25 bottom, $4.92 below the old range low, and below the thin lower shelf at $758.68–$758.79 (the Oct 23 and Oct 1 lows, two touches) as well. On completed bars, the four closes above the zone from Oct 26 to Oct 29 are now followed by a close underneath it — the push above the zone has failed its first closing test, which is a narrow pass for the break, not yet a held retest. The day's low of $750.36 stopped $0.76 above $749.60, the Sep 16 low — a wider-frame reference from before the plotted window, not a level today's bar tested and held. Breadth, on the latest published reading, was still constructive before today: 65.8% of S&P 500 members were above their 50-day average as of Oct 29 (StockCharts data via Ryan Detrick, published Oct 30) — that is Thursday's reading; no Friday breadth figure had been published by this check, so no fresh breadth claim is made here.
- The index scoreboard shows the same concentration as Thursday, one step louder. The S&P 500 index fell 1.8% — its worst day since June — the Nasdaq Composite fell 2.9% and the Dow Jones Industrial Average fell 1.1% (Associated Press closing recap) — index figures, not ETF prices. IWM, the Russell 2000 ETF, closed at $279.33, down 1.65% (Finnhub, completed bar — an ETF price, not the index level). Intel closed down 28.6% at $65.76 and Reddit down 29.2% at $91.73 (Finnhub, completed bars); the Associated Press put Intel's fall at about 29%, its worst day since 1974, on the weak fourth-quarter outlook, and Reuters figures carried in the same recap put Nvidia down 5.3%, AMD down 12.1% and the semiconductor index down 8.7%. Amazon, down as much as 6% early, closed down 1.9% (AP). The offset stayed narrow: ExxonMobil closed up 2.16% at $187.25 and Chevron up 1.75% at $235.52 (Finnhub) after this morning's verified beats. Against that, LSEG data cited by Reuters put 82% of the 299 S&P 500 companies that had reported by Oct 30 ahead of consensus — the selling is grading AI spending name by name, not earnings in general.
- Rates eased while oil jumped, and the morning's data cut both ways. The 10-year Treasury yield fell to 4.93% from Thursday's 4.98% close (AP) — the equity fall coincided with a bid for Treasuries, not a rates spike. Brent crude for December settled up $2.76, or 2.4%, at $117.64 a barrel, its highest since April, and WTI settled up $2.12, or 2.08%, at $104.12 (Reuters settlement report). Gold futures fell 3.7% to $3,883 an ounce, their lowest since last September (Investopedia). Bitcoin was $77,004, down 4.23%, and ether $2,240, down 3.32%, in a post-market snapshot (Finnhub, ~4:30pm ET), as crypto-linked shares fell after reports of a security incident at Binance (Investopedia). The Chicago Business Barometer fell to 55.3 in October from 58.8, below the 56.0 consensus but still in expansion, while its prices-paid measure rose 8.9 points to its highest since December 2021 (MNI Indicators, via Dow Jones Newswires) — growth cooling, input prices hot, on top of the morning's in-line Employment Cost Index (+0.8%).
- Earnings reconciliation, and what tonight holds. The postmarket pass verified 45 more results from dated official releases, taking the earnings file to 445 verified rows — 48 of them for Oct 30 itself, including Sanofi, Canadian National, Magna, Lear, AutoNation and Piper Sandler from this morning's slate, and BP, whose reported diluted EPS of $1.79 per ADS was found in its official RNS income statement after the morning check had captured only its adjusted measure. Where the official release states no GAAP EPS, none was recorded: Federal Realty's $1.87 is Nareit/Core FFO per share, not EPS, and Oxford Square's release was logged as released without a verified GAAP per-share figure — both stay labelled, not guessed. Still unresolved and carried forward: Banco de Chile (no dated official release found), Grupo Televisa and Cementos Pacasmayo (filings/releases confirmed, no per-share EPS retrievable from the official document), Haleon and NextDecade (statements with no EPS), and the small-cap TBA names with no Oct 30 release. No large-cap reports are scheduled after tonight's close — the next closing evidence for today's break is Monday's session itself. A question to study, not a trade: after a closing break on heavy volume, what would Monday's bar need to show — a rally into the broken shelf that fails, or one that closes back above it — to separate a one-day flush from an accepted move lower?
Analyst interpretation: today is the first closing evidence in two weeks that changes the frame. Four completed closes above the $764.25–$766.71 zone have been followed by a close below the zone, below the old range low and below the lower shelf, on roughly double Thursday's volume — that grades the push above the zone as failed for now, while one close is still only a narrow pass for the break: a held retest has not happened yet, in either direction. The macro mix argues against heroics in both directions: the 10-year yield eased to 4.93% even as equities fell, Brent settled at $117.64, and Chicago prices paid hit their highest since December 2021 — event risk has not cleared, it has changed shape, with Apple and Palantir on Monday night, the midterm elections on Tuesday and the jobs report on Friday. A hypothetical teaching example only — not a market quote and not a trade: a $10-wide put credit spread (sell one put, buy a lower-strike put with the same expiry, in the Options Industry Council's definition) sold for a hypothetical $1.60 credit has a maximum gain of $1.60, a maximum loss of $8.40 plus fees, and a breakeven at the short strike minus $1.60. If the underlying finishes between the strikes at expiry with the spread worth $5.00, the loss is $3.40 before fees — the full $8.40 is lost only at or below the long strike — and the short put carries assignment risk before expiry. Waiting puts no option premium at risk; its cost is possibly missing a further move, not a spread loss. No edge today — sitting out is also a position.
A further completed close below $758.68, the lower shelf's bottom (the Oct 23 low), after a session that rallies into the $758.68–$760.64 area — the broken shelf and old range low — and closes back below it, would grade the break as accepted on a held retest, which is stronger evidence than today's single close. A completed QQQ close below $683.45, today's intraday low, would separately show the growth side making new closing lows rather than steadying.
A completed close back above $758.79, the lower shelf's top (the Oct 1 low), would start grading today's close as a probe below the shelf rather than an accepted break; a completed close back above $766.71, the zone top (the Oct 14 low), would complete that reversal and put the $764.25–$766.71 zone back in play as the frame's centre.
Awaiting confirmation — no confirmed fills dated Oct 30 had been recorded in the activity log at this check, so no action is stated here and none is inferred from that absence.
Sources
- SPY daily bars (open/high/low/close), completed through Oct 30 — StockAnalysisOct 30, 2026, 4:00pm ET close (completed bars through Oct 30)
- QQQ daily bars (open/high/low/close), completed through Oct 30 — StockAnalysisOct 30, 2026, 4:00pm ET close (completed bars through Oct 30)
- Closing recap: S&P 500 index -1.8% (worst day since June), Nasdaq Composite -2.9%, Dow -1.1%; 10-year yield fell to 4.93% from 4.98%; Intel about -29%, worst day since 1974; Amazon -1.9%; Nvidia -5.3%, AMD -12.1%, semiconductor index -8.7% and LSEG 82% beat rate of 299 reporters (Reuters figures) — Associated Press, via EL7Oct 30, 2026, 8:11pm UTC (4:11pm ET), reporting the completed Oct 30 session
- Intel (INTC) close $65.76, -28.58%; Reddit (RDDT) close $91.73, -29.22%; ExxonMobil (XOM) close $187.25, +2.16%; Chevron (CVX) close $235.52, +1.75%; IWM (Russell 2000 ETF) close $279.33, -1.65% — FinnhubOct 30, 2026, regular-session close (post-market snapshot ~4:30pm ET)
- Breadth: 65.8% of S&P 500 members above their 50-day average as of Oct 29 (StockCharts data, Ryan Detrick) — TradingView News (Seeking Alpha)Published Oct 30, 2026, 2:57pm UTC; reading as of Oct 29, 2026 close
- Oil settlement: Brent December futures settled up $2.76 (+2.4%) at $117.64, highest since April; WTI settled up $2.12 (+2.08%) at $104.12 — Reuters, via Global Banking & FinanceOct 30, 2026, settlement
- Gold futures fell 3.7% to $3,883 an ounce, lowest since last September; WTI futures up 2.4% to more than $104; bitcoin below $77,000 after Binance security-incident reports — Investopedia closing recapOct 30, 2026, after the close (~4:22pm ET crawl)
- Bitcoin $77,004 (-4.23%) and ether $2,240 (-3.32%) — FinnhubOct 30, 2026, post-market snapshot (~4:30pm ET)
- Chicago Business Barometer fell to 55.3 in October from 58.8 (consensus 56.0); prices paid rose 8.9 points to the highest since December 2021 — MNI Indicators, via Dow Jones Newswires / MorningstarOct 30, 2026, 10:13am ET (release at 9:45am ET)
- Next sessions: Apple fiscal Q4 after the close Mon Nov 2, 2026; ISM manufacturing Nov 2 at 10:00am ET — MarketBeat calendar reportWeek of Nov 2, 2026 (checked Oct 30, 2026)
- Palantir (PLTR) reports Mon Nov 2, 2026 after market close — EarningsWatcherOct 30, 2026
- Next week brings the U.S. midterm elections (Tue Nov 3, 2026) — Barron's live coverageOct 30, 2026