
Daily brief · 2026-10-29
Historical edition · New York time. These observations reflect their published date, not current market conditions.
GDP beats, core PCE in line — SPY slips from the shelf it cannot close above
two closes inside the shelf, no break: GDP +3.4%, core PCE 3.1%, December hike priced at 83%, 10-year near 5.02%
Chart analysis
Published chart · Tap chart to enlarge.
Published chart lesson
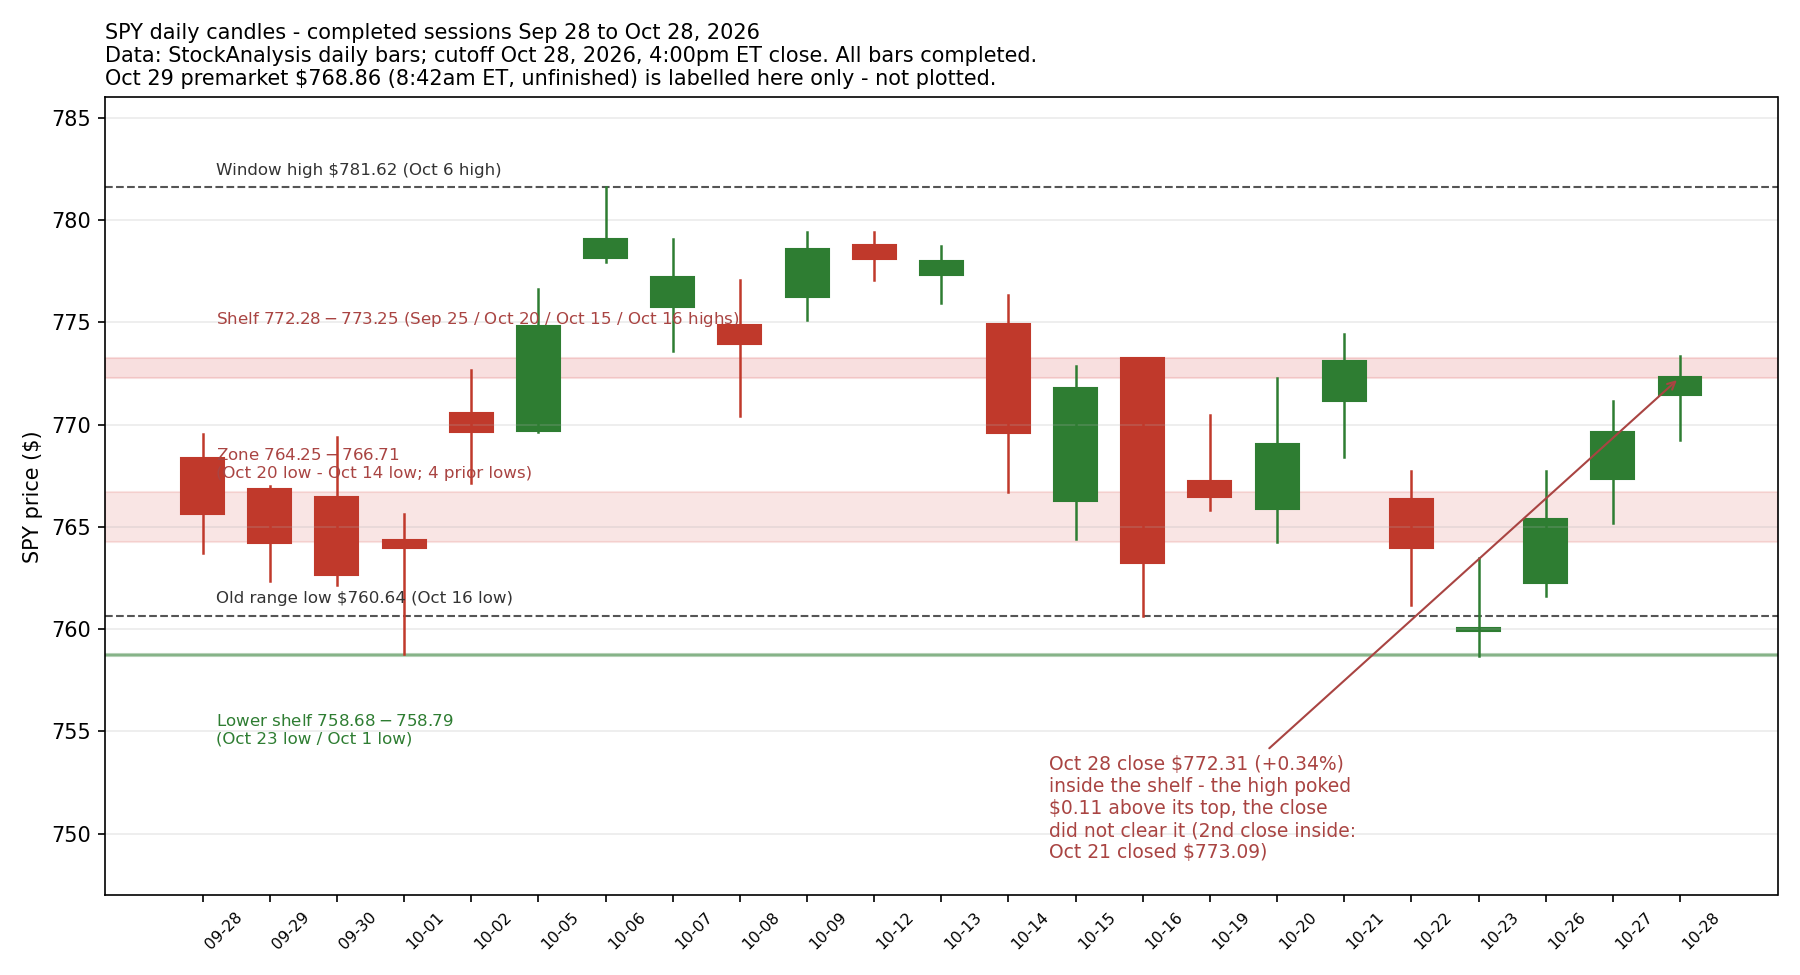
Two closes inside a shelf are evidence about the shelf, not a break of it. SPY's $772.28-$773.25 shelf is built from four prior completed highs (StockAnalysis daily bars): the Oct 21 bar reached $774.44 and closed at $773.09 inside the shelf, and Wednesday's completed bar reached $773.36 and closed at $772.31, also inside it — two intraday pokes above the $773.25 top, zero completed closes above it, so on a closing basis the shelf has held twice. A premarket print below the shelf (SPY $768.86 at 8:42am ET, unfinished) does not change that grade either; only completed closes do. What would weaken the lesson: a completed close above $773.25 would show the shelf finally giving way on a closing basis, and a completed close below $766.71, the zone top (the Oct 14 low), would show the repair failing back into the zone.
Brief analysis source: SPY daily bars, StockAnalysis, Oct 28, 2026 (completed close) . Chart uses its own dated Yahoo series; vendor levels can differ.
Three key points
- The 8:30am ET data leaned hot: Q3 GDP grew 3.4% against a 3.1% forecast, core PCE rose 0.3% in September (3.1% year over year, exactly as expected) and jobless claims printed 194K against 199K expected — leaving a December 9 hike priced at 83% (CME FedWatch via IBD).
- On completed bars, SPY closed Wednesday at $772.31, up 0.34% (StockAnalysis) — inside the $772.28-$773.25 shelf for the second time, after Oct 21 — and traded at $768.86 in premarket at 8:42am ET (unfinished): below the shelf, above the $766.71 zone top, with today's completed close still to grade the test.
- Options learning point: two closes inside a shelf are not a break and a premarket slip is not a close — confirmation is graded on completed bars — and any premium sold today must survive Amazon and Intel tonight plus Friday's Employment Cost Index, while waiting puts no option premium at risk.
Read the full brief and sources
- The 8:30am ET data leads, and it leans hot on both sides of the Fed's problem. Q3 GDP grew at a 3.4% annual rate in the advance estimate, above the 3.1% forecast and up from Q2's 2.2% (Bureau of Economic Analysis, via Investor's Business Daily). September core PCE — the Fed's preferred inflation gauge — rose 0.3% on the month and 3.1% from a year earlier, both exactly as expected, while headline PCE rose 0.5% on the month and 3.6% year over year on higher energy costs (BEA, via MarketWatch). Weekly jobless claims printed 194K against 199K expected, with continuing claims also below forecast (Department of Labor, via investinglive). Stronger growth with inflation still rising does not argue against the priced path: markets put an 83% chance on a 25bp hike at the Dec 9 meeting (CME FedWatch, via IBD), and S&P 500 futures remained modestly lower after the data (IBD).
- Start with the widest frame, on completed daily bars. SPY (the S&P 500 ETF) on Wednesday opened at $771.43, reached $773.36, held a low of $769.24 and closed at $772.31, up 0.34% (StockAnalysis daily bars) — a third straight gain (completed closes of $765.37, $769.66, then $772.31) that carried price from below the zone to inside the shelf. The completed Sep 28-Oct 28 window still runs from $781.62 (the Oct 6 high) down to $758.68 (the Oct 23 low), so Wednesday's close sits about 1.2% below the window high: the repair has retraced most of the slide, inside the same wide range. On the weekly frame, the last completed week (Oct 19-23) closed at $759.97 near its low; this week's three completed bars have climbed back to the shelf, but the week is unfinished — only Friday's close completes it. QQQ (the Nasdaq-100 ETF) closed Wednesday at $725.61, up 0.60% (completed bar) — leading on the way up, and still well below its own Oct 6 window high of $762.86.
- Inside that frame, the shelf is the story: it has now absorbed two closes without giving up a closing break. The $772.28-$773.25 shelf is built from four prior highs — the Sep 25 high ($772.28), the Oct 20 high ($772.29), the Oct 15 high ($772.87) and the Oct 16 high ($773.25) — and both the Oct 21 bar (close $773.09, high $774.44) and Wednesday's bar (close $772.31, high $773.36) poked above it intraday and finished inside it. This morning's unfinished prints point the other way and grade nothing: SPY traded at $768.86 in premarket at 8:42am ET, down 0.45% (StockAnalysis, unfinished) — below the shelf bottom but $2.15 above the $766.71 zone top — and QQQ traded at $715.81 at 8:41am ET, down 1.35% (StockAnalysis, unfinished), while Nasdaq-100 futures fell about 1.1% and Alphabet slid 10.5% in premarket trading after its report (Investopedia; Reuters). Below the premarket print sits the cleared zone, $764.25-$766.71 (four prior lows: Oct 20, Oct 15, Oct 19 and Oct 14), then the old reference-range low at $760.64 (the Oct 16 low), then the thin lower shelf at $758.68-$758.79 (the Oct 23 and Oct 1 lows, two touches). Today's completed close does the grading.
- Participation and sentiment say repair, not enthusiasm. The latest published S&P 500 breadth figure at this check is still Monday's: 60.8% of members above their 50-day average (Market Scholars, Oct 26); no Tuesday or Wednesday update had been published by the 8:45am ET check, so no newer breadth claim is made here. The fresh AAII survey (week ended Wednesday Oct 28, published this morning) shows pessimism easing but still elevated: bullish 37.8% (+0.9 pts), bearish 41.4% (-4.4 pts, still well above its 31.5% historical average), neutral 20.7% (+3.4 pts) and a bull-bear spread of -3.6% (AAII Sentiment Survey) — and that survey week largely predates yesterday afternoon's Fed decision and today's data. Overnight, Japan's Nikkei rose 1.10% while China's Shanghai Composite fell 0.82%, and Europe's STOXX 600 was up 0.58% (Barron's); in the same snapshot the 10-year Treasury yield was 5.017%, Brent crude futures were down 1.35%, gold futures down 0.09% and bitcoin down 1.68% at $80,127. The ECB decides this morning at 9:15am ET (a hold at a 2.50% deposit rate is expected, Admiral Markets calendar) — one more rate story on a day already full of them.
- This morning's BMO earnings, verified from official releases, were led by Lilly and the industrials. Eli Lilly reported diluted EPS of $7.22 and non-GAAP diluted EPS of $7.48 on revenue of $24.4 billion and raised full-year revenue guidance to $91.0-$92.0 billion (PR Newswire). Caterpillar reported profit per share of $7.13 and adjusted profit per share of $7.20 on sales and revenues of $20.7 billion, up 17%, with a record backlog cited (PR Newswire). Merck reported GAAP diluted EPS of $2.04 and non-GAAP EPS of $2.49 on sales of $18.1 billion (Merck release); Bristol-Myers Squibb reported GAAP diluted EPS of $1.05 and non-GAAP diluted EPS of $1.35 on total revenues of $13.07 billion, raising its revenue guide while cutting its non-GAAP EPS guide (Business Wire). Shell reported IFRS diluted EPS of $2.13 per share ($4.26 per ADS) and adjusted earnings of $1.93 per share ($3.86 per ADS) (GlobeNewswire); Cheniere reported diluted net income per share of $5.65 with consolidated adjusted EBITDA of $1.90 billion and raised full-year guidance (Business Wire); Crocs reported GAAP diluted EPS of $4.52 and adjusted diluted EPS of $3.69 on revenue of $1,042.6 million and raised its outlook (PR Newswire), and its shares were up 17.8% in premarket trading (Barron's). Two names stay unverified rather than guessed: Mastercard posts its release only on its investor site and the official document was not captured at this check, and SiriusXM's full release text could not be read directly, so both remain on the reconciliation queue alongside the rest of today's large BMO slate. Tonight, Amazon and Intel report after the close (calls at 5:00pm ET) — the next test of AI spending after Alphabet's split reaction. A question to study, not a trade: Lilly and Caterpillar both delivered strength on the same morning the data argued for higher rates — does that breadth beyond tech survive Amazon's capital-spending update tonight?
Analyst interpretation: the morning gave the shelf test a headwind, not a verdict. The data confirmed the setup the Fed left yesterday — growth strong enough (GDP +3.4%) and inflation sticky enough (core PCE 3.1% year over year) that a December hike stays priced at 83% — while the chart itself is unchanged on completed bars: two closes inside the $772.28-$773.25 shelf, no closing break, and a premarket print that grades nothing. Through a conservative put-seller's lens, the calendar is again the risk: Amazon and Intel tonight, the Employment Cost Index tomorrow, and a shelf that has absorbed two probes. A hypothetical teaching example only — not a market quote and not a trade: a $10-wide put credit spread (sell one put, buy a lower-strike put with the same expiry, in the Options Industry Council's definition) sold for a hypothetical $2.40 credit has a maximum gain of $2.40, a maximum loss of $7.60 plus fees, and a breakeven at the short strike minus $2.40. If the underlying finishes between the strikes at expiry with the spread worth $5.00, the loss is $2.60 before fees — the full $7.60 is lost only at or below the long strike — and the short put carries assignment risk before expiry. Waiting puts no option premium at risk; its cost is possibly missing a further move, not a spread loss. Mid-range, with the shelf unpassed and events stacked, waiting is a valid position.
A completed close above $773.25, the top of the $772.28-$773.25 shelf (the Oct 16 high), would be the first closing evidence through the shelf — a narrow pass on its own; a later session that dips toward the shelf and closes above it would grade the retest as held, which is stronger evidence. A completed close that holds above $766.71, the zone top (the Oct 14 low), on a down day would separately show the cleared zone still working as support.
A completed close back below $766.71, the zone top (the Oct 14 low), would put SPY inside the $764.25-$766.71 zone again and grade the three closes above it as a false break; a completed close below $764.25, the zone bottom (the Oct 20 low), would reopen the $760.64 old range low (the Oct 16 low) as the next test.
Sources
- SPY daily bars (open/high/low/close) and Oct 29 premarket print $768.86 at 8:42am ET (unfinished) — StockAnalysisOct 28, 2026, 4:00pm ET close (completed bars through Oct 28); premarket Oct 29, 2026, 8:42am ET
- QQQ daily bars and Oct 29 premarket print $715.81 at 8:41am ET (unfinished) — StockAnalysisOct 28, 2026, 4:00pm ET close (completed bars through Oct 28); premarket Oct 29, 2026, 8:41am ET
- Q3 GDP +3.4% vs 3.1% forecast, core PCE +0.3% m/m and 3.1% y/y as expected, December hike odds 83%, futures modestly lower after the data — Investor's Business DailyOct 29, 2026, 8:32am ET update
- Headline PCE +0.5% m/m and 3.6% y/y; GDP +3.4% — MarketWatch (BEA data)Oct 29, 2026, morning ET
- Weekly jobless claims 194K vs 199K expected; continuing claims 1.701M vs 1.720M expected — investinglive (Department of Labor data)Oct 29, 2026, 8:30am ET release
- AAII Sentiment Survey, week ended Oct 28, 2026: bullish 37.8%, neutral 20.7%, bearish 41.4% — AAIIOct 29, 2026 (survey week ended Oct 28, 2026)
- Premarket snapshot: Nasdaq futures down 1.1%, S&P 500 and Dow futures down 0.3%, WTI $101.90, gold $4,040, bitcoin about $80,100, 10-year yield about 5.02% — InvestopediaOct 29, 2026, morning ET
- Premarket snapshot: S&P 500 futures down 0.21%, Dow futures down 0.07%, 10-year yield 5.017%, Brent down 1.35%, bitcoin $80,127; Asia (Nikkei +1.10%, Shanghai -0.82%) and Europe (STOXX 600 +0.58%); Crocs up 17.8% premarket — Barron'sOct 29, 2026, morning ET
- Nasdaq futures slide; Alphabet down 10.5% and Microsoft up 3.5% in premarket trading — ReutersOct 29, 2026
- S&P 500 breadth: 60.8% of members above their 50-day average at Monday's close — the latest published reading at this check — Market ScholarsOct 26, 2026 close
- Eli Lilly Q3 2026 results: reported diluted EPS $7.22, non-GAAP $7.48, revenue $24.4B, guidance raised — PR NewswireOct 29, 2026
- Merck Q3 2026 results: GAAP diluted EPS $2.04, non-GAAP $2.49, sales $18.1B — MerckOct 29, 2026
- Bristol-Myers Squibb Q3 2026 results: GAAP diluted EPS $1.05, non-GAAP $1.35, revenues $13.07B — Business WireOct 29, 2026
- Shell Q3 2026 results: IFRS diluted EPS $2.13 per share ($4.26 per ADS), adjusted earnings $1.93 per share ($3.86 per ADS) — GlobeNewswireOct 29, 2026
- Cheniere Q3 2026 results: diluted net income per share $5.65, adjusted EBITDA $1.90B, guidance raised — Business WireOct 29, 2026
- Crocs Q3 2026 results: GAAP diluted EPS $4.52, adjusted $3.69, revenue $1,042.6M, outlook raised — PR NewswireOct 29, 2026
- ECB decision at 9:15am ET (hold at 2.50% deposit rate expected); Amazon and Intel after the close; Friday ECI and ExxonMobil — Admiral Markets weekly calendarOct 28, 2026
Zone held on the close, shelf untested — Nasdaq falls 1.38% as Alphabet slides
rotation, not rout: megacap tech fell hard while small caps rose — SPY closed mid-range, above the zone, below the shelf
Chart analysis
Published chart · Tap chart to enlarge.
Published chart lesson
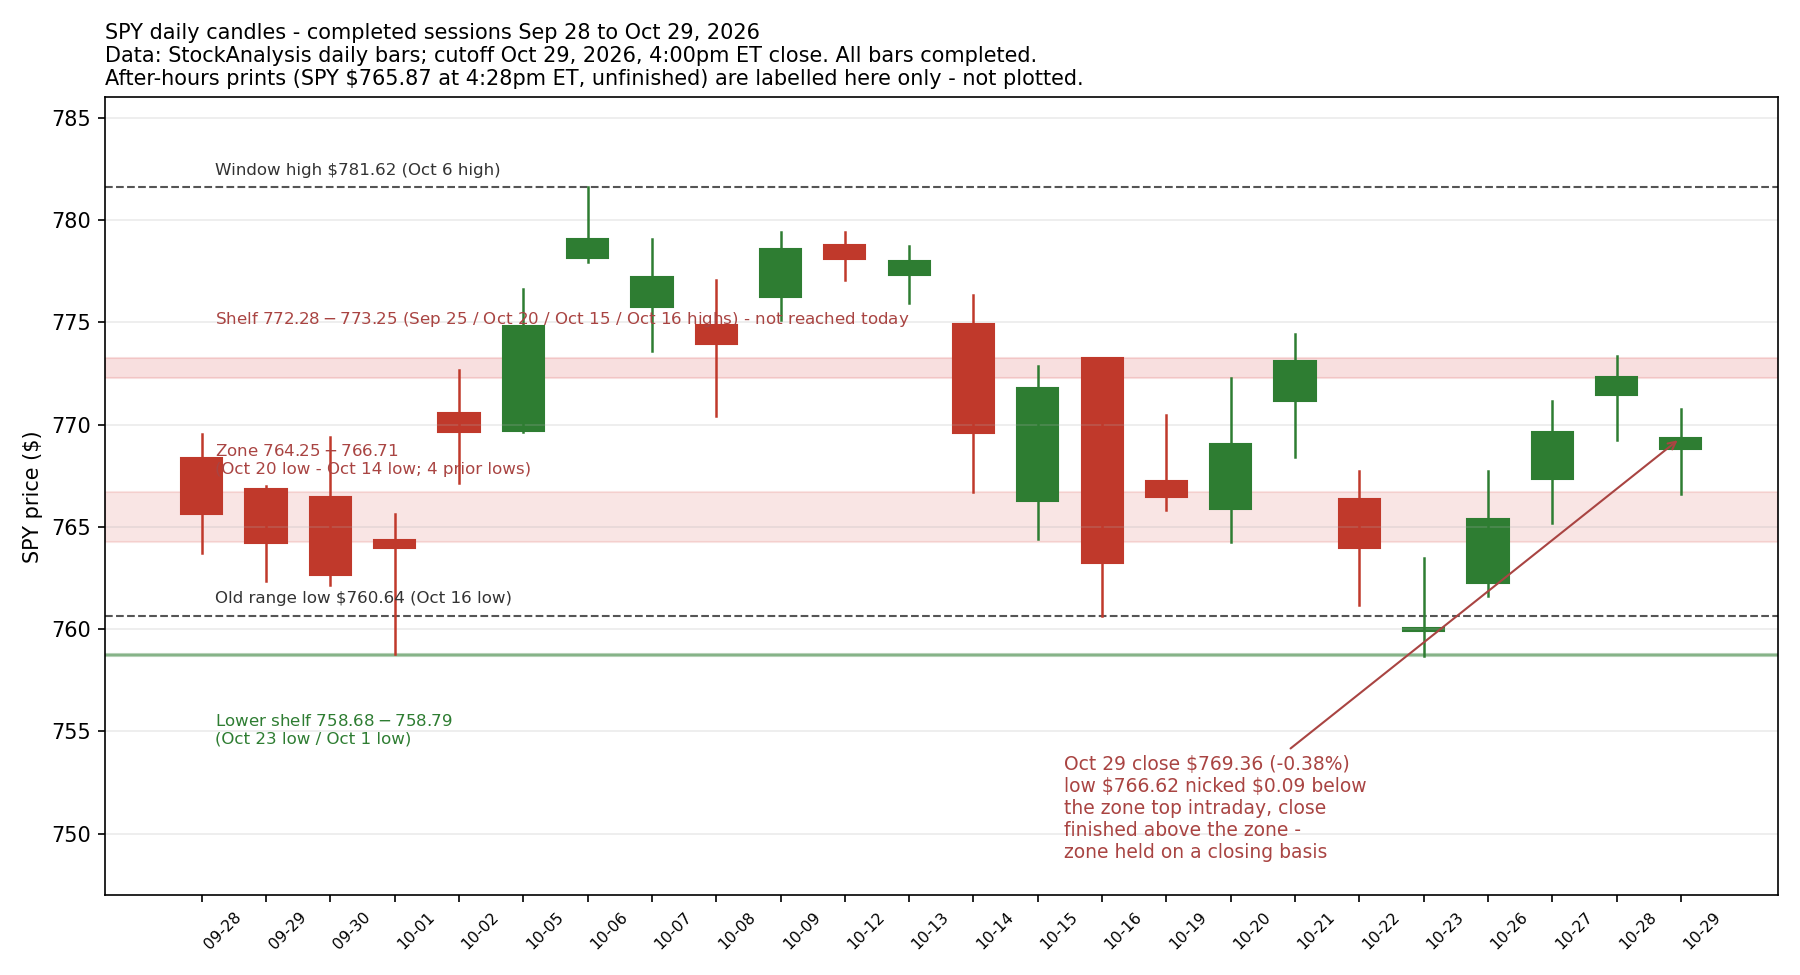
An intraday poke through a level is not a closing break of it. SPY's $764.25–$766.71 zone is built from four prior completed lows (StockAnalysis daily bars): today's completed bar dipped to $766.62 — $0.09 below the $766.71 zone top (the Oct 14 low) — and then closed at $769.36, above the whole zone. On the evidence of completed bars, the zone was probed at its edge and held for one close; that is a narrow pass, not proven support, and it says nothing by itself about Friday. What would weaken the lesson: a completed close at or below $766.71 would put SPY back inside the zone and grade today's hold as a one-day event, and a completed close below $764.25 (the Oct 20 low, the zone bottom) would grade the closes above the zone since Oct 26 as a false break.
Brief analysis source: SPY daily bars, StockAnalysis, Oct 29, 2026 (completed close) . Chart uses its own dated Yahoo series; vendor levels can differ.
Three key points
- SPY closed Thursday at $769.36, down 0.38% (StockAnalysis, completed bar): the low of $766.62 nicked $0.09 below the $766.71 zone top intraday, but the close finished above the $764.25–$766.71 zone — the zone held on a closing basis, and the $772.28–$773.25 shelf was not reached today.
- The selling was concentrated, not broad: the S&P 500 index fell 0.30% to 7,720.39 and the Nasdaq Composite 1.38% to 26,184.72 (Invezz closing recap), while IWM, the Russell 2000 ETF, rose 0.97% and Alphabet alone fell 12.64% (Finnhub) — and the 10-year yield eased to 4.988% (Dow Jones Data Talk via Morningstar).
- Options learning point: tonight's Amazon and Intel reports moved those shares more than 7% and 17% after hours (IBD; WSJ) — after the close that graded the index — so premium sold ahead of dated earnings must survive gaps no completed bar warned about, while waiting puts no option premium at risk.
Read the full brief and sources
- Start with the widest frame, on completed daily bars. SPY (the S&P 500 ETF) on Thursday opened at $768.79, reached $770.76, held a low of $766.62 and closed at $769.36, down 0.38% (StockAnalysis daily bars, completed bar). The completed Sep 28–Oct 29 window still runs from $781.62 (the Oct 6 high) down to $758.68 (the Oct 23 low), so today's close sits about 1.6% below the window high and near the middle of the range — the repair that carried three straight gains into Wednesday has stalled, not reversed, on a closing basis. On the weekly frame this week's four completed closes are $765.37, $769.66, $772.31 and $769.36; the week is unfinished — only Friday's close completes it. The 16:00 ET close grades today's tests only: tonight's Amazon and Intel reports came after it and are graded separately below.
- Inside that frame, the morning's test was the cleared zone, and it held on a closing basis — narrowly. The $764.25–$766.71 zone is built from four prior lows (Oct 20, Oct 15, Oct 19 and Oct 14). Today's completed low of $766.62 nicked $0.09 below the $766.71 zone top intraday, but the completed close of $769.36 finished $2.65 above the zone top: an intraday poke into the zone's edge, not a closing break back inside it. The $772.28–$773.25 shelf above (four prior highs: Sep 25, Oct 20, Oct 15 and Oct 16) was never tested today — the high of $770.76 fell $1.52 short of its bottom — so after two closes inside the shelf (Oct 21 and Oct 28), today adds a third kind of evidence: a close below it that held the zone underneath. QQQ (the Nasdaq-100 ETF) closed at $715.34, down 1.42% (completed bar), with a low of $711.62 — still above its Oct 16 low of $707.23 and Oct 23 low of $701.16, and still well below its Oct 6 window high of $762.86.
- The index scoreboard shows where the selling sat. The S&P 500 index fell 0.30% to 7,720.39, the Nasdaq Composite fell 1.38% to 26,184.72 and the Dow Jones Industrial Average slipped 0.25% to 52,342.56 (Invezz closing recap, Oct 29, ~4:17pm ET) — index figures, not ETF prices. The Russell 2000 index advanced on the day (Invezz); its ETF gauge, IWM, closed at $284.01, up 0.97% (StockAnalysis, completed bar — an ETF price, not the index level). Around 1pm ET the equal-weight S&P 500 was up about 0.9% with more stocks rising than falling, health care up about 2.1% and financials up about 1.5% while technology fell (TickerRoast midday read, intraday and unfinished at that timestamp) — the average stock rose while the cap-weighted Nasdaq fell, which is concentration, not broad selling. No newer S&P 500 breadth figure (share of members above their 50-day average) had been verified by this check: the latest sourced figure remains Monday's 60.8% (Market Scholars, Oct 26), so no fresh breadth claim is made here.
- Rates eased while oil stayed heavy, and the day's biggest single-stock moves were earnings reactions. The 10-year Treasury yield fell 5.6 basis points to 4.988% (Dow Jones Data Talk via Morningstar, 3:00pm ET Tradeweb values) — back below 5% after Wednesday's 5.05% Treasury par yield. WTI crude settled at $101.41 a barrel and Brent at $110.27, down from $102.78 and $115.32 on Wednesday (EL7 closing data). Gold's spot reference was $4,010.90 an ounce, down 0.33%, at 2:10pm ET (price-chart.com, an afternoon reference, not a settlement). Bitcoin was $80,400, down 0.99%, and ether $2,318, down 1.71%, in a post-market snapshot (Finnhub, ~4:30pm ET). Among completed regular-session moves, Alphabet's Class A shares fell 12.64% to $283.82 (Finnhub) after Wednesday night's miss and negative free cash flow; Caterpillar fell about 9% despite beating on earnings and revenue, as its construction sales came in light (Invezz); Eli Lilly rose 6.63% to $1,373.70 (Finnhub) after raising its outlook; and ServiceNow and Fortinet each fell more than 20% after their reports (Invezz).
- Tonight's after-hours earnings are a separate, later development — they did not decide the 16:00 ET close, and Friday's full session is their first closing grade. Amazon reported GAAP diluted EPS of $1.89 on net sales of $201.9 billion, up 12%, with operating income of about $28.1 billion (a 13.9% margin) and AWS sales up 39% to about $46 billion, while trailing-twelve-month free cash flow was an outflow of $42.4 billion (Amazon release, via Business Wire); EPS missed the $1.97 FactSet consensus (MarketWatch) and the shares fell more than 7% in after-hours trading (Investor's Business Daily). Intel reported GAAP EPS of $0.60 and non-GAAP EPS of $0.52 on revenue of $16.5 billion, up 21% (Intel release) — above the $0.41 adjusted consensus — but guided fourth-quarter non-GAAP EPS to $0.25 against $0.45 expected, on revenue of $15.0–$16.0 billion against $17.29 billion expected (FactSet, via WSJ), and the shares fell 17% in after-hours trading (WSJ). Gilead also reported in the same window: adjusted EPS of $2.55 on revenue of $8.3 billion, both above estimates, with its full-year sales outlook raised (Reuters). A question to study, not a trade: three straight nights of big-tech reports have punished spending faster than growth — what evidence in Friday's session would show that judgment spreading beyond the names that reported, rather than staying name-specific?
Analyst interpretation: today graded as a stall inside the range, not a break of it. The completed close held above the $764.25–$766.71 zone after a $0.09 intraday nick of its top, the shelf above went untested, and the damage in the indexes sat in a handful of very large technology names while small caps and the average stock rose — that mix argues for patience over eagerness through a conservative put-seller's lens, with Friday's Employment Cost Index and the oil majors' reports still ahead and this week's bar unfinished. A hypothetical teaching example only — not a market quote and not a trade: a $10-wide put credit spread (sell one put, buy a lower-strike put with the same expiry, in the Options Industry Council's definition) sold for a hypothetical $2.10 credit has a maximum gain of $2.10, a maximum loss of $7.90 plus fees, and a breakeven at the short strike minus $2.10. If the underlying finishes between the strikes at expiry with the spread worth $4.00, the loss is $1.90 before fees — the full $7.90 is lost only at or below the long strike — and the short put carries assignment risk before expiry. Compared with that spread, waiting puts no option premium at risk; its cost is possibly missing a further move, not a spread loss. Mid-range, with the week's bar unfinished and dated events stacked on Friday morning, waiting is a valid position.
A completed close above $773.25, the top of the $772.28–$773.25 shelf (the Oct 16 high), would be the first closing evidence through the shelf — a narrow pass on its own; a later session that dips toward the shelf and closes above it would grade the retest as held, which is stronger evidence. A further completed close that holds above $766.71, the zone top (the Oct 14 low), after tonight's earnings would separately add a second day of evidence that the zone is working on a closing basis.
A completed close back below $766.71, the zone top (the Oct 14 low), would put SPY inside the $764.25–$766.71 zone again and start grading the closes above it since Oct 26 as a false break; a completed close below $764.25, the zone bottom (the Oct 20 low), would confirm that grade and reopen the $760.64 old range low (the Oct 16 low) as the next test.
Closed two positions and opened a position — traced to confirmed fills dated Oct 29 in the activity record; no names, strikes or dollar amounts are stated here, and exact execution detail for today's entries stays pending sheet reconciliation.
Sources
- SPY daily bars (open/high/low/close), completed through Oct 29 — StockAnalysisOct 29, 2026, 4:00pm ET close (completed bars through Oct 29)
- QQQ daily bars (open/high/low/close), completed through Oct 29 — StockAnalysisOct 29, 2026, 4:00pm ET close (completed bars through Oct 29)
- IWM (Russell 2000 ETF) daily bars — StockAnalysisOct 29, 2026, 4:00pm ET close (completed bar)
- Closing recap: S&P 500 index 7,720.39 (-0.30%), Nasdaq Composite 26,184.72 (-1.38%), Dow 52,342.56 (-0.25%), Russell 2000 advanced; Caterpillar, ServiceNow, Fortinet moves — InvezzOct 29, 2026, ~4:17pm ET
- Alphabet Class A (GOOGL) close $283.82, -12.64%; Eli Lilly (LLY) close $1,373.70, +6.63% — FinnhubOct 29, 2026, post-market snapshot (~4:30pm ET)
- Midday breadth/rotation read: equal-weight S&P 500 up about 0.9%, health care and financials leading — TickerRoastOct 29, 2026, ~1:00pm ET (midday, unfinished at that timestamp)
- 10-year Treasury yield falls to 4.988%, down 5.6bp (Tradeweb 3:00pm ET values) — Dow Jones Data Talk via MorningstarOct 29, 2026, 3:51pm ET (3:00pm ET values)
- WTI settled $101.41 and Brent $110.27 on Oct 29, against $102.78 and $115.32 on Oct 28 — EL7 closing dataOct 29, 2026, session close
- Gold spot reference $4,010.90, -0.33% — price-chart.comOct 29, 2026, 18:10 UTC (2:10pm ET, afternoon reference)
- Bitcoin $80,400 (-0.99%) and ether $2,318 (-1.71%) — FinnhubOct 29, 2026, post-market snapshot (~4:30pm ET)
- Amazon Q3 2026 results: GAAP diluted EPS $1.89, net sales $201.9B, AWS up 39%, TTM free cash flow outflow $42.4B — Amazon release via Business WireOct 29, 2026, ~4:05pm ET release
- Amazon shares fell more than 7% after hours; EPS $1.89 vs $1.97 FactSet consensus — Investor's Business Daily / MarketWatchOct 29, 2026, after-hours
- Intel Q3 2026 results: GAAP EPS $0.60, non-GAAP EPS $0.52, revenue $16.5B; Q4 guidance — Intel official releaseOct 29, 2026, after 4:00pm ET
- Intel shares fell 17% after hours on Q4 guidance (non-GAAP EPS $0.25 vs $0.45 FactSet) — WSJ live coverageOct 29, 2026, after-hours
- Gilead Q3: adjusted EPS $2.55 on revenue of $8.3B, full-year sales outlook raised — ReutersOct 29, 2026, after-hours
- Next sessions: Employment Cost Index Fri Oct 30 at 8:30am ET, ExxonMobil and Chevron before Friday's open, Chicago PMI 9:45am ET — Admiral Markets calendarWeek of Oct 26–30, 2026 calendar (checked Oct 29, 2026)