
Daily brief · 2026-10-26
Historical edition · New York time. These observations reflect their published date, not current market conditions.
SPY opens back above $760.64 — only a close there cancels Friday's range break
one-close range break, unconfirmed: premarket back above the old low, breadth improving, 10-year near 5% into FOMC week
Chart analysis
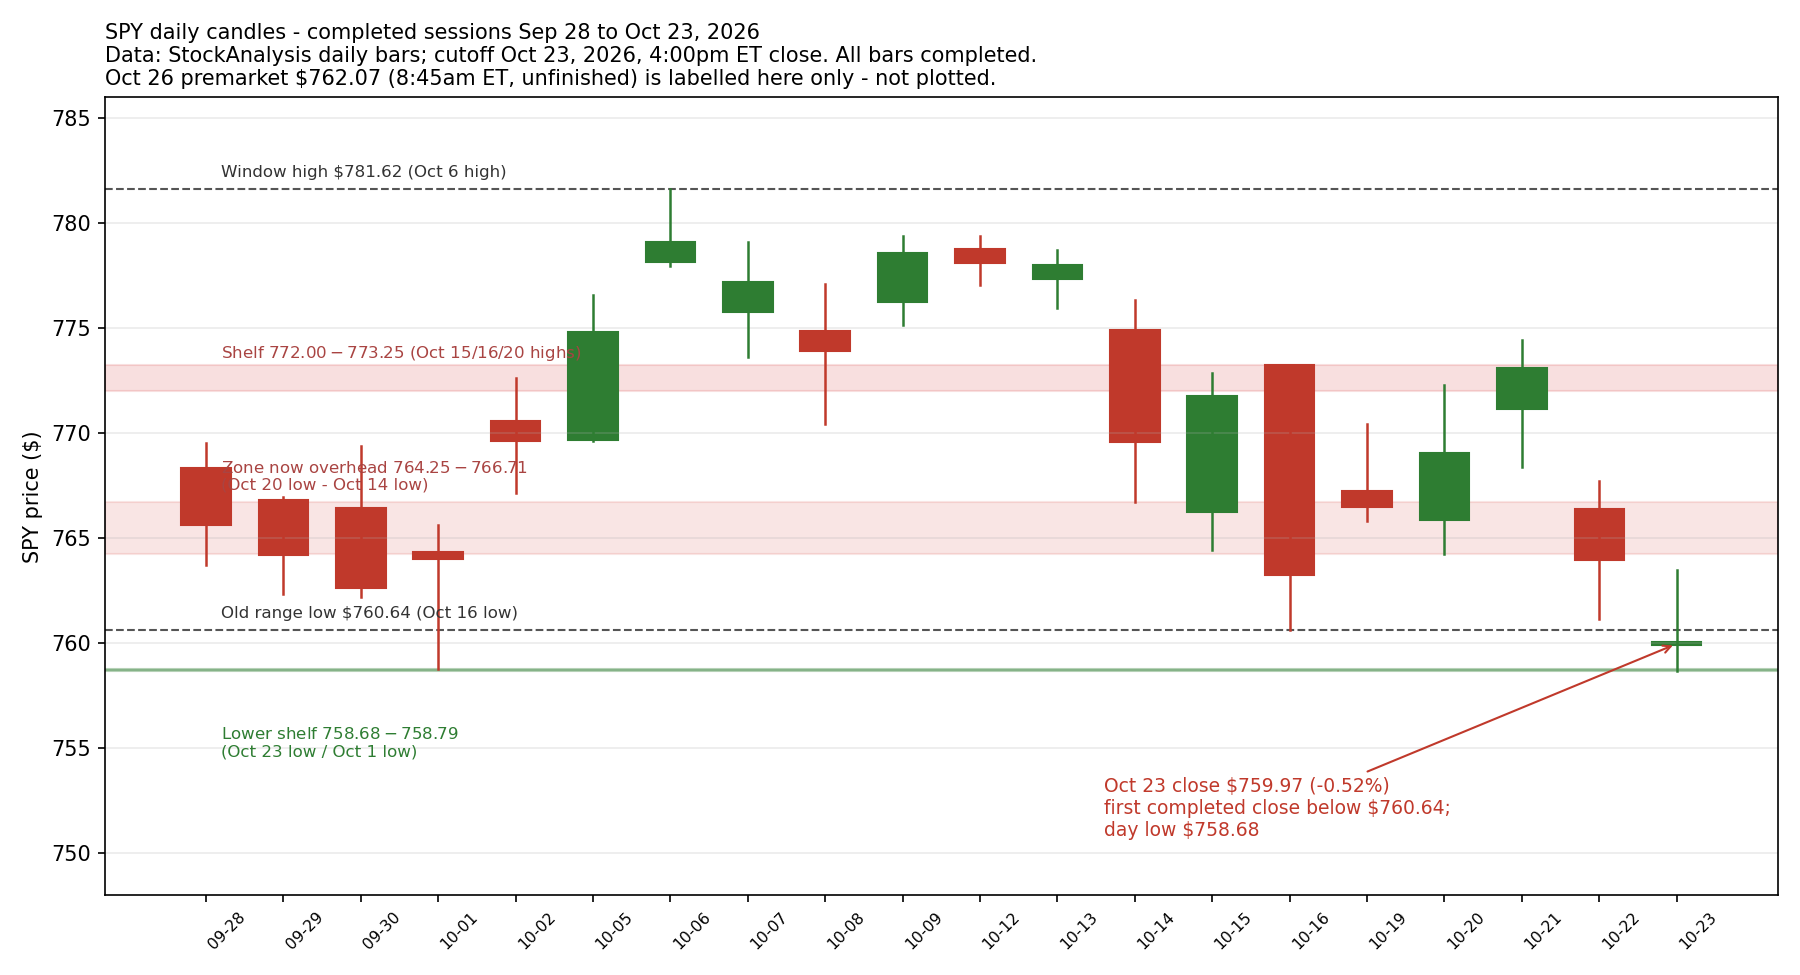
Published chart · Tap chart to enlarge.
Published chart lesson
A break is graded by the close, and a premarket reclaim is not a close. SPY's $760.64 range low was set by the Oct 16 completed low (StockAnalysis daily bars), Friday's completed close of $759.97 landed $0.67 below it, and this morning's premarket print of $762.07 at 8:45am ET (StockAnalysis, unfinished) sits back above it — three different kinds of evidence, and only the completed closes grade the break. The premarket print sets up today's retest of the level from below; it does not cancel Friday's close, just as an intraday rally back above the low on Friday did not cancel it either. The lesson weakens if completed closes start landing on both sides of $760.64 with no reaction at the level — a price the market ignores has been absorbed, and the map needs redrawing around the $758.68-$758.79 shelf below and the $764.25-$766.71 zone above.
Brief analysis source: SPY daily bars, StockAnalysis historical data, completed sessions through Oct 23, 2026 close (Oct 23 bar: open $759.90, high $763.47, low $758.68, close $759.97); premarket indication StockAnalysis, Oct 26, 2026, 8:45am ET (unfinished). Annotated chart: /today/2026-10-26-spy-break-retest.png (same SPY daily series, completed through Oct 23 close; premarket labelled, not plotted). . Chart uses its own dated Yahoo series; vendor levels can differ.
Three key points
- On completed bars, SPY closed Friday at $759.97 — the first completed close below the Oct 12-22 reference-range low of $760.64 (Oct 16 low, StockAnalysis) — and this morning's unfinished premarket print of $762.07 at 8:45am ET sits back above that level, $2.18 below the $764.25-$766.71 zone overhead.
- There is no 8:30am ET release today; the week's tests stack into Wednesday Oct 28 (FOMC decision at 2:00pm ET, a hold priced at 90.6% by CME FedWatch via FXStreet, then Alphabet and Microsoft after the close) and Thursday Oct 29 (Q3 GDP and Core PCE at 8:30am ET, then Amazon after the close), while this morning's verified BMO earnings were led by Verizon (GAAP diluted EPS $1.25, adjusted $1.31, guidance raised).
- Options learning point: a premarket move back above a broken level is an unfinished bar, not a cancelled break — only a completed close grades it, and any options position opened today carries Wednesday's FOMC decision and Thursday's Core PCE print inside its breakeven, not just its maximum gain.
Read the full brief and sources
- Start with the widest frame, on completed daily bars. SPY (the S&P 500 ETF) finished last week below the Oct 12-22 reference range: Friday's completed bar opened at $759.90, reached $763.47, fell to $758.68 and closed at $759.97, down 0.52% (StockAnalysis daily bars) — the first completed close below the range low of $760.64 set by the Oct 16 low (the window high was $779.40 on Oct 12; a min/max envelope used as an interpretive reference range, not an established box). On the wider Sep 28-Oct 23 completed window, SPY sits near the bottom: the window high is $781.62 (Oct 6) and the window low is Friday's $758.68. The completed weekly frame agrees — last week's high of $774.44 (Oct 21) was lower than the prior week's $779.40, and the weekly close of $759.97 was a second straight down week. One close below a range low is a narrow pass for a break on the grading used in these briefs; today is the first session that can add follow-through or take it back.
- Inside that frame, the map is now two-sided. Overhead, the first test is the old range low itself, $760.64, and above it the $764.25-$766.71 zone — built from the Oct 20 low ($764.25), the Oct 15 low ($764.43), the Oct 19 low ($765.82) and the Oct 14 low ($766.71) at its top, four touches that held as support before two closes below it — with the $772.00-$773.25 shelf (the Oct 15, Oct 16 and Oct 20 highs) above that. Below Friday's close sits a thin lower shelf at $758.68-$758.79, built from just two lows: Friday's $758.68 and the Oct 1 low of $758.79. QQQ (the Nasdaq-100 ETF) never confirmed Friday's break in the same way: it closed at $704.40, down 0.01%, between $701.16 and $709.30 (StockAnalysis) — essentially flat after Thursday's 2.86% fall, still far below its own $724.55-$729.43 zone but not making a new closing low.
- This morning's unfinished prints lean toward the take-it-back side, without grading anything. SPY traded at $762.07 in premarket at 8:45am ET, up 0.28% (StockAnalysis, unfinished) — back above the $760.64 old range low, but still $2.18 below the $764.25 bottom of the zone overhead. Index futures pointed the same way earlier: at 5:19am ET, Dow E-minis were up 0.49%, S&P 500 E-minis up 0.30% and Nasdaq-100 E-minis up 0.25% (Reuters), and Investopedia's later check had Dow futures up 0.4%, S&P 500 futures up 0.3% and Nasdaq futures up 0.5%. A premarket print above a level is an unfinished bar, not a reclaim: only today's completed close grades whether Friday's break stands, and a close back above $760.64 would return SPY to the old range without yet reclaiming the zone above it.
- Breadth and rates pull in opposite directions, and there is no 8:30am ET release today to settle it. On the Oct 23 close, 61% of S&P 500 members were above their 50-day average, up 5 points and the highest since mid-August (Kobeissi Letter data via TokenPost) — participation improved on the very day the index closed below its range low, so the break is an index-level fact that member breadth has not confirmed. Retail sentiment was already dark before the drop: the latest AAII survey (week ended Oct 21, published Oct 22) put bullish at 36.9%, bearish at 45.8% and the spread at -8.9%. Against that, the 10-year Treasury yield was little changed at about 5.01% this morning (Investopedia), WTI crude futures eased about 2% to $101.10 after last week's spike, gold futures rose less than 1% to $4,030 and bitcoin moved back above $80,000. A hold at 3.75-4.00% on Wednesday Oct 28 is priced at 90.6% (CME FedWatch via FXStreet), leaving a hike tail of about 9%.
- This morning's BMO earnings, verified from official releases, were led by Verizon: GAAP diluted EPS of $1.25 and adjusted EPS of $1.31, with full-year guidance raised for a third straight quarter — a steadier read on the consumer than Friday's telecom selloff implied. Other verified BMO results: Bank of Hawaii GAAP diluted EPS $1.49, Lakeland Financial $1.14, HBT Financial $0.86, Alliance Resource Partners GAAP EPS $1.08 per unit, Easterly Government Properties GAAP net income $0.12 per share with Core FFO of $0.78 (a REIT FFO figure, not EPS), and Medifast a GAAP loss of $1.57 per diluted share with an adjusted loss of $0.19. Cadence Design Systems reports after today's close — and per the chronology these briefs keep, today's 4:00pm ET close precedes that release. Research candidates — questions to study, not trades to take: when an index closes below a range low while member breadth improves, how often does the first retest from below hold, and does breadth keep diverging if the zone overhead is reclaimed?
Analyst interpretation: Friday's break is real on the only basis that grades it — a completed close below $760.64 — but it is narrow, unconfirmed by breadth, and this morning's unfinished premarket print at $762.07 already sits back above the level. That is a genuinely two-sided setup: the sellers' evidence is the close itself and a 10-year yield still near 5.01%; the other side's evidence is 61% of members above their 50-day average on the break day, a flat QQQ close, oil easing about 2% and Verizon's raised guide this morning. Through a conservative put-seller's lens, the calendar argues louder than the $0.67 break margin. Take a clearly hypothetical example (not a market quote and not a trade): a hypothetical $5-wide put credit spread sold for a $1.25 credit has a maximum gain of $1.25, a maximum loss of $3.75 plus fees, and a breakeven at expiry of the short strike minus $1.25; if the underlying expires between the strikes with the spread worth $2.50, the result is a $1.25 loss before fees — the full maximum loss applies only at or below the long strike at expiry, and the short put carries early-assignment risk (Options Industry Council definitions). Opened today, that breakeven must survive the FOMC decision, the Core PCE print and three mega-cap earnings reports in three sessions. Waiting, by contrast, puts no option premium at risk — it risks missing a reclaim, not losing a spread. Mid-box tests are graded by closes; until one prints, patience is the position the evidence supports.
The range break gains follow-through if SPY posts a second completed close below $760.64 — the Oct 16 low that set the bottom of the Oct 12-22 reference range — or if a retest from below trades up toward $760.64-$764.25 (the old range low up to the Oct 20 low at the bottom of the former support zone) and then closes back below $760.64; a completed close below the $758.68-$758.79 lower shelf (the Oct 23 and Oct 1 lows) would be stronger evidence still. All of these are closing-basis tests, not premarket or intraday prints.
The break is invalidated if SPY posts a completed close back above $760.64, returning the price to the Oct 12-22 reference range — this morning's unfinished premarket print at $762.07 does not count until it survives to a close — and the read is fully reversed if a later completed close also reclaims the $764.25-$766.71 zone, above its $764.25 bottom (the Oct 20 low) and then its $766.71 top (the Oct 14 low), which would grade Friday's close below the range as a one-session dip that buyers took back.
Sources
- SPY daily bars: Oct 23 open $759.90, high $763.47, low $758.68, close $759.97 (-0.52%); Sep 28-Oct 23 window high $781.62 (Oct 6); Oct 12-22 reference range $760.64 (Oct 16 low) to $779.40 (Oct 12 high); zone lows $764.25 (Oct 20), $764.43 (Oct 15), $765.82 (Oct 19), $766.71 (Oct 14); Oct 1 low $758.79 — StockAnalysis historical dataCompleted sessions through Oct 23, 2026
- SPY premarket $762.07, +0.28% (unfinished indication) — StockAnalysisOct 26, 2026, 8:45am ET (premarket, unfinished)
- QQQ daily bar Oct 23: open $702.20, high $709.30, low $701.16, close $704.40 (-0.01%) — StockAnalysis historical dataCompleted sessions through Oct 23, 2026, 4:00pm ET close
- At 5:19am ET: Dow E-minis up 0.49%, S&P 500 E-minis up 0.30%, Nasdaq-100 E-minis up 0.25%; about one-third of S&P 500 companies report this week, including Alphabet, Microsoft and Amazon — ReutersOct 26, 2026, 5:19am ET
- Futures higher recently (Dow +0.4%, S&P 500 +0.3%, Nasdaq +0.5%); WTI crude futures down about 2% at $101.10, gold futures up less than 1% to $4,030, bitcoin back above $80,000, 10-year Treasury yield little changed at 5.01%; Verizon lifted its full-year outlook; Fed widely expected to hold, traders pricing a 90% hold chance per CME FedWatch — InvestopediaOct 26, 2026, before the open
- S&P 500 breadth at the Oct 23 close: 61% of members above their 50-day average, up 5 points, highest since mid-August; 57% above their 200-day average — Kobeissi Letter data via TokenPostOct 23, 2026, market close (published Oct 25, 2026)
- AAII Sentiment Survey, week ended Oct 21, 2026: bullish 36.9%, neutral 17.3%, bearish 45.8%, bull-bear spread -8.9% — AAIIPublished Oct 22, 2026 (survey week ended Oct 21, 2026)
- CME FedWatch: 90.6% probability the Fed holds at 3.75-4.00% at the Oct 27-28 meeting, 79.7% probability of a hike by December — FXStreet citing CME FedWatchOct 26, 2026, European hours
- Verizon Q3 2026 official release: EPS $1.25, Adjusted EPS $1.31, net income $5.3bn, revenue $34.3bn, full-year guidance raised — GlobeNewswireOct 26, 2026, before the open
- Next week calendar: Tuesday Oct 27 durable orders and consumer confidence, Visa, Coca-Cola and Boeing earnings; Wednesday Oct 28 FOMC decision and Alphabet and Microsoft after the close; Thursday Oct 29 Q3 GDP and September PCE/Core PCE, Amazon after the close — Morningstar week-ahead calendarWeek of Oct 26-30, 2026 (published Oct 23, 2026)
SPY closes back above $760.64 — Friday's break cancelled, zone top still ahead
break cancelled, reclaim unfinished: first close back above $760.64 lands inside the old zone, 10-year at 4.987% into FOMC week
Chart analysis
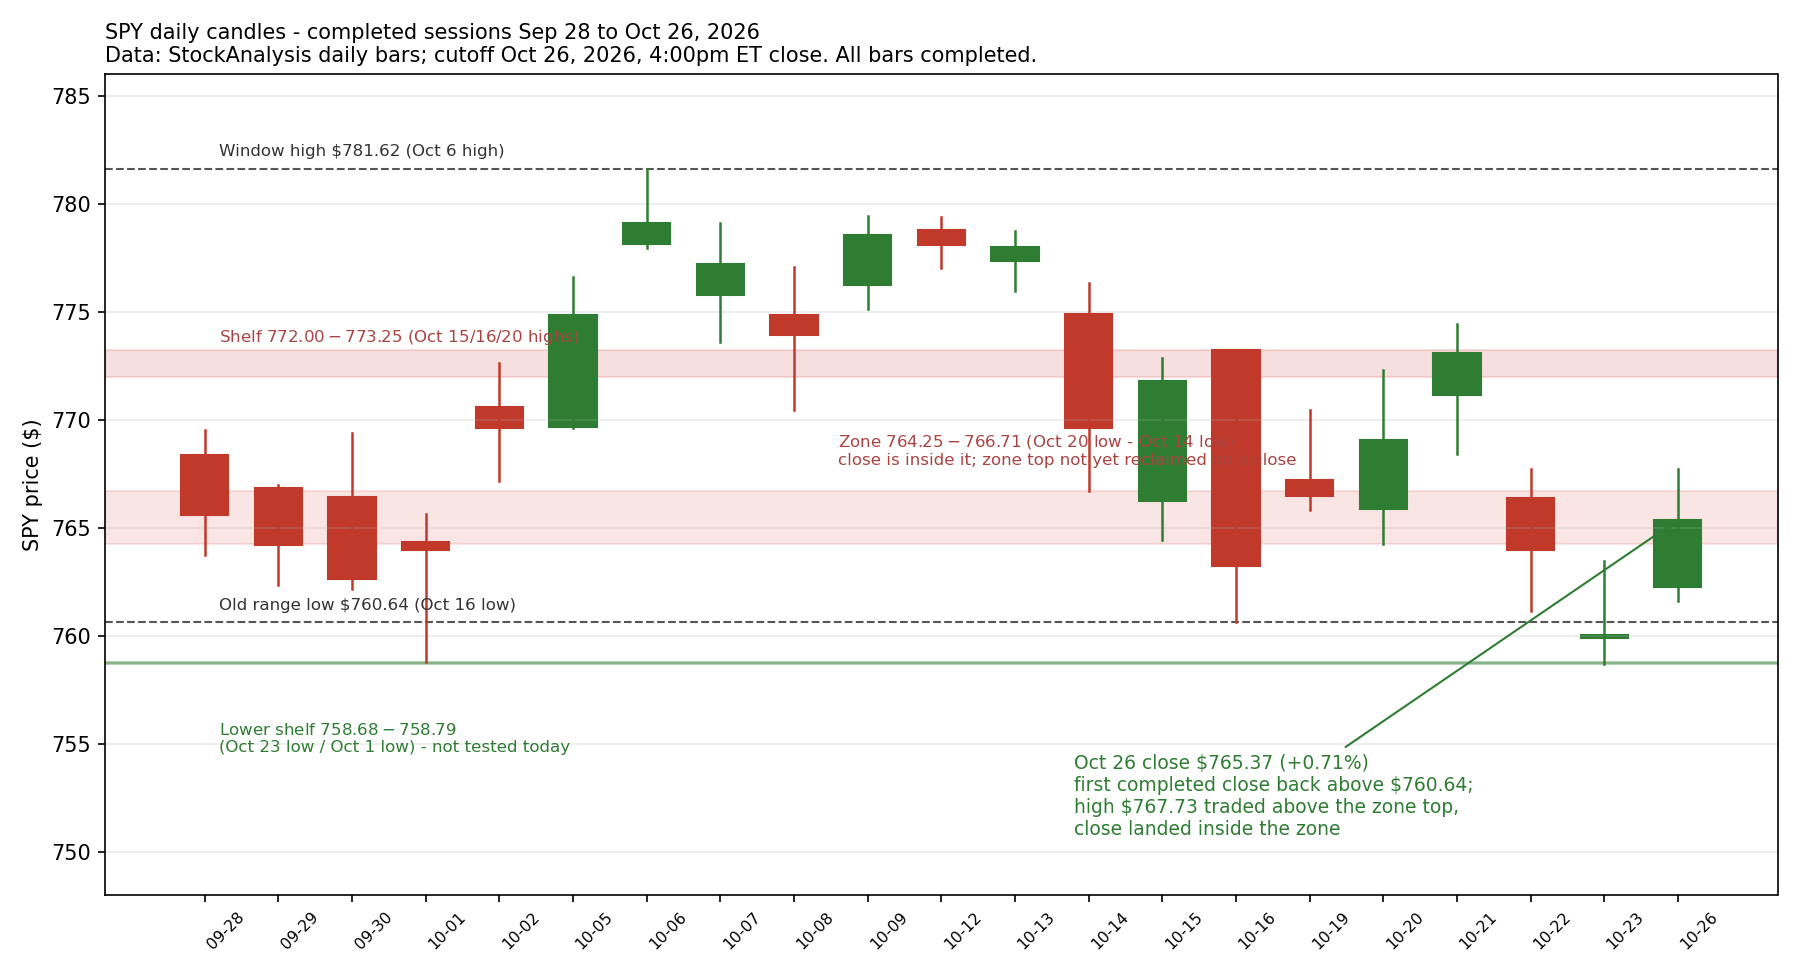
Published chart · Tap chart to enlarge.
Published chart lesson
A reclaim is graded in steps, and an intraday trade above a level is not a close above it. SPY's day high of $767.73 traded $1.02 above the $766.71 top of the $764.25-$766.71 zone (the zone top is the Oct 14 low), but the completed close of $765.37 landed inside the zone (StockAnalysis daily bars, completed Oct 26 bar) — so the range break at $760.64 is cancelled on a closing basis, while the zone reclaim is not yet complete: two different levels, two different grades, from the same bar. The lesson weakens if completed closes start landing on both sides of the zone with no reaction at its edges — a zone the market ignores has been absorbed, and the map needs redrawing around the $772.00-$773.25 shelf above and the $760.64 range low below.
Brief analysis source: SPY daily bars, StockAnalysis historical data, completed sessions through Oct 26, 2026 close (Oct 26 bar: open $762.25, high $767.73, low $761.63, close $765.37). Annotated chart: /today/2026-10-26-spy-reclaim-zone.png (same SPY daily series, completed through Oct 26 close). . Chart uses its own dated Yahoo series; vendor levels can differ.
Three key points
- SPY posted its first completed close back above the Oct 12-22 reference-range low — $765.37 against the $760.64 level set by the Oct 16 low (StockAnalysis, completed Oct 26 bar) — cancelling Friday's one-close range break, but the close landed inside the $764.25-$766.71 zone rather than above its top.
- The S&P 500 index rose 0.70% to 7,676.77 and the Nasdaq Composite 0.82% to 26,169.38 (WSJ), while the 10-year Treasury yield was essentially unchanged at 4.987% and WTI oil futures fell 1.5% to $101.76; the week's larger tests are Wednesday's FOMC decision with Alphabet and Microsoft earnings, then Thursday's GDP and Core PCE data with Amazon's report.
- Options learning point: a cancelled break is not a completed reclaim — a position opened at today's close still carries Wednesday's FOMC decision and Thursday's Core PCE print inside its breakeven, and a completed close back below $760.64 would reinstate the break that today's close just cancelled.
Read the full brief and sources
- Start with the widest frame, on completed daily bars. SPY (the S&P 500 ETF) opened at $762.25, reached $767.73, fell to $761.63 and closed at $765.37, up 0.71% (StockAnalysis daily bars, completed Oct 26 bar) — the first completed close back above $760.64, the Oct 16 low that set the bottom of the Oct 12-22 reference range. That meets the morning brief's invalidation test on a closing basis: Friday's one-close break below the range is cancelled. In the wider Sep 28-Oct 26 completed window, the close still sits in the lower half — the window high is $781.62 (Oct 6) and the window low is $758.68 (Oct 23) — and the lower shelf at $758.68-$758.79 (the Oct 23 and Oct 1 lows) was never tested today, with the day's low $2.84 above its top.
- The close did not finish the reclaim. SPY's close of $765.37 landed inside the $764.25-$766.71 zone — built from the Oct 20 low ($764.25), the Oct 15 low ($764.43), the Oct 19 low ($765.82) and the Oct 14 low ($766.71), four touches that held as support before the break — and while the day's high of $767.73 traded $1.02 above the zone top, a trade above a level is not a close above it. On the grading used in these briefs, the reclaim is a narrow pass: back inside the old range, not yet back through the zone, with the $772.00-$773.25 shelf (the Oct 15, Oct 16 and Oct 20 highs) above that. QQQ (the Nasdaq-100 ETF) rose more: open $707.06, high $715.25, low $705.58, close $712.20, up 1.11% (StockAnalysis, completed bar) — a stronger day, still below its own $724.55-$729.43 zone (the Oct 19 and Oct 15 highs).
- The index closes agree with the ETF read. The S&P 500 index rose 53.09 points, or 0.70%, to 7,676.77; the Nasdaq Composite rose 214.04 points, or 0.82%, to 26,169.38; and the Dow Jones Industrial Average rose 146.42 points, or 0.28%, to 52,361.58 (WSJ) — no record close was reported for any of them in the sources checked. Small caps rose less: IWM (the Russell 2000 ETF) closed at $276.99, up 0.45% (StockAnalysis) — an ETF figure, not the Russell 2000 index level, which was not separately verified at this check. S&P 500 sectors were mostly higher, led by industrials and technology, while communication services lagged (Investor's Business Daily). The latest sourced breadth figure is still Friday's: 61% of S&P 500 members above their 50-day average at the Oct 23 close (Kobeissi Letter data via TokenPost); no sourced Oct 26 breadth figure was available at this check, so none is claimed.
- Rates barely moved while oil eased, and the rally coincided with Anthropic's initial-public-offering filing, which the WSJ said stemmed anxiety about a potential AI bubble ahead of tech earnings — a shared timing, not a proven cause. The 10-year Treasury yield was essentially unchanged at 4.987%, while the 2-year rose 0.032 of a percentage point to 4.712% (WSJ). WTI oil futures fell $1.51, or 1.5%, to $101.76 a barrel (WSJ), Brent crude settled at $115.81, down 0.78% (Dow Jones Data Talk via Morningstar), gold futures rose $31.20, or 0.8%, to $4,022.30 an ounce (WSJ), and bitcoin fell nearly 1% to about $80,000 (Investor's Business Daily). Among single stocks, Lumentum rose about 10% and Comfort Systems about 8% as the S&P 500's top performers (Investor's Business Daily), Nvidia rose 2.39% to $216.00, and Verizon fell 3.49% to $43.10 (Finnhub closing data) on the day it raised its full-year outlook — the raised guide did not hold the stock.
- Tonight's after-close earnings are a separate development — today's 4:00pm ET close precedes them, and the next full session is what grades them. Verified from official releases: Cadence Design Systems posted GAAP diluted EPS of $1.05 and non-GAAP diluted EPS of $2.11 on revenue of $1.633 billion and raised its 2026 outlook (company release; the pre-release Visible Alpha estimate, via Investopedia, was $2.05 adjusted on $1.62 billion of revenue). Also verified tonight: Public Storage net income of $1.69 per share with Core FFO of $4.34 per share (a REIT FFO figure, not EPS), Hartford net income of $4.82 per diluted share with core earnings of $3.50, Cincinnati Financial net income of $2.96 per diluted share with non-GAAP operating income of $2.86, and Rambus GAAP diluted EPS of $0.69 with non-GAAP diluted EPS of $0.84. Welltower reported normalized FFO of $1.67 per diluted share (an FFO figure, not EPS); its GAAP per-share figure was not verified at this check. Nucor, Celestica, Brown & Brown, Principal Financial and Sun Communities were scheduled after the close, but no official release for them had been verified by about 4:35pm ET — they stay on the reconciliation queue for the next run. Research candidates — questions to study, not trades to take: when a one-day range break is cancelled the next session, how often does the reclaimed zone hold on its first retest from above, and does QQQ's stronger close change that answer?
Analyst interpretation: today grades as a narrow pass for the reclaim, not a reversal. The evidence for the calmer read is a completed close back above $760.64, a QQQ close up 1.11%, sectors mostly higher, and a 10-year yield that ended essentially unchanged at 4.987%. The evidence against calling it finished is just as concrete: the close stopped inside the $764.25-$766.71 zone it still needs to clear, the day's high above the zone top did not survive to the close, and the calendar stacks the FOMC decision, Alphabet and Microsoft earnings, GDP and Core PCE, and Amazon's report into the next three sessions. Through a conservative put-seller's lens, that stack matters more than one green close. Take a clearly hypothetical example (not a market quote and not a trade): a hypothetical $5-wide put credit spread sold for a $1.25 credit has a maximum gain of $1.25, a maximum loss of $3.75 plus fees, and a breakeven at expiry of the short strike minus $1.25; if the underlying expires between the strikes with the spread worth $2.50, the result is a $1.25 loss before fees — the full maximum loss applies only at or below the long strike at expiry, and the short put carries early-assignment risk (Options Industry Council definitions). Waiting, by contrast, puts no option premium at risk — it risks missing a further reclaim, not losing a spread. The zone top at $766.71 is the next closing test; until a completed close clears it and holds a retest, patience is the position the evidence supports.
The reclaim strengthens if SPY posts a completed close above $766.71 — the Oct 14 low that sets the top of the $764.25-$766.71 zone — and a later retest of that zone from above holds with a close still above $766.71; a completed close above the $772.00-$773.25 shelf (the Oct 15, Oct 16 and Oct 20 highs) would be stronger evidence still. All of these are closing-basis tests, not intraday trades above the levels.
The reclaim fails if SPY posts a completed close back below $760.64 — the Oct 16 low that set the bottom of the Oct 12-22 reference range — which would reinstate Friday's range break; a completed close below the $758.68-$758.79 lower shelf (the Oct 23 and Oct 1 lows) would be stronger evidence against the reclaim than a close between $760.64 and that shelf.
Opened and closed positions today, per confirmed fills recorded in the activity log. (No other broad action is stated; anything not in the log is awaiting confirmation.)
Sources
- SPY daily bars: Oct 26 open $762.25, high $767.73, low $761.63, close $765.37 (+0.71%); Sep 28-Oct 26 window high $781.62 (Oct 6), window low $758.68 (Oct 23); Oct 12-22 reference range low $760.64 (Oct 16 low); zone lows $764.25 (Oct 20), $764.43 (Oct 15), $765.82 (Oct 19), $766.71 (Oct 14); Oct 1 low $758.79 — StockAnalysis historical dataCompleted sessions through Oct 26, 2026, 4:00pm ET close
- QQQ daily bar Oct 26: open $707.06, high $715.25, low $705.58, close $712.20 (+1.11%) — StockAnalysis historical dataCompleted sessions through Oct 26, 2026, 4:00pm ET close
- Index closes Oct 26: S&P 500 +53.09 (+0.70%) to 7,676.77, Nasdaq Composite +214.04 (+0.82%) to 26,169.38, Dow +146.42 (+0.28%) to 52,361.58; 10-year Treasury yield 4.987% (essentially unchanged), 2-year 4.712% (+0.032 points); gold futures +$31.20 (+0.8%) to $4,022.30; oil futures -$1.51 (-1.5%) to $101.76; Anthropic IPO filing stemmed AI-bubble anxiety ahead of tech earnings and the Fed statement — WSJOct 26, 2026, after the 4:00pm ET close
- IWM (Russell 2000 ETF) daily bar Oct 26: close $276.99 (+0.45%) — StockAnalysis historical data (ETF figure, not the Russell 2000 index level)Completed sessions through Oct 26, 2026, 4:00pm ET close
- S&P 500 sectors mostly higher, led by industrials and technology, communication services lagging; Lumentum up about 10% and Comfort Systems about 8% among the index's top performers; bitcoin fell nearly 1% to about $80,000 — Investor's Business Daily live market coverageOct 26, 2026, near the close (live coverage)
- Front-month Brent crude settled at $115.81, down $0.91 (-0.78%) — Dow Jones Market Data via Morningstar Data TalkOct 26, 2026, 3:10pm ET settlement report
- Closing prices Oct 26: Nvidia $216.00 (+2.39%), Verizon $43.10 (-3.49%) — Finnhub market dataOct 26, 2026, regular-session close
- S&P 500 breadth at the Oct 23 close: 61% of members above their 50-day average, up 5 points, highest since mid-August — Kobeissi Letter data via TokenPost (latest sourced figure; no Oct 26 figure verified at this check)Oct 23, 2026, market close (published Oct 25, 2026)
- Cadence Q3 2026 official release (Business Wire via Cadence IR): revenue $1.633bn, GAAP diluted EPS $1.05, non-GAAP diluted EPS $2.11, 2026 outlook raised (revenue growth 21%, non-GAAP EPS $8.40) — Cadence Design SystemsOct 26, 2026, after the close
- Public Storage Q3 2026 official release: net income $1.69 per share, Core FFO $4.34 per share (REIT FFO figure, not EPS), guidance raised — Business WireOct 26, 2026, after the close
- Hartford Q3 2026 official release: net income $4.82 per diluted share, core earnings $3.50 per diluted share — Business WireOct 26, 2026, after the close
- Cincinnati Financial Q3 2026 official release: net income $2.96 per diluted share, non-GAAP operating income $2.86 per diluted share — PR NewswireOct 26, 2026, after the close
- Rambus Q3 2026 official release: GAAP diluted EPS $0.69, non-GAAP diluted EPS $0.84, revenue $218.3m — Business WireOct 26, 2026, after the close
- Tuesday Oct 27 calendar: September durable goods orders at 8:30am ET (1.4% increase expected after a 0.1% decline, CNBC) and October consumer confidence at 10:00am ET (80.3 consensus after 81.9 in September, MarketScreener) — ad-hoc news market reportOct 26, 2026 (calendar for Oct 27-28, 2026)
- Week calendar: FOMC decision Wednesday Oct 28 at 2:00pm ET, Alphabet and Microsoft after Wednesday's close, Q3 GDP and September PCE/Core PCE Thursday Oct 29 at 8:30am ET, Amazon after Thursday's close — Morningstar week-ahead calendarWeek of Oct 26-30, 2026 (published Oct 23, 2026)