
Daily brief · 2026-10-23
Historical edition · New York time. These observations reflect their published date, not current market conditions.
SPY starts below its support zone — the Oct 16 range low at $760.64 is today's test
range stress at the bottom edge: SPY closed under its support zone, premarket near the $760.64 range low, 10-year back above 5%
Chart analysis
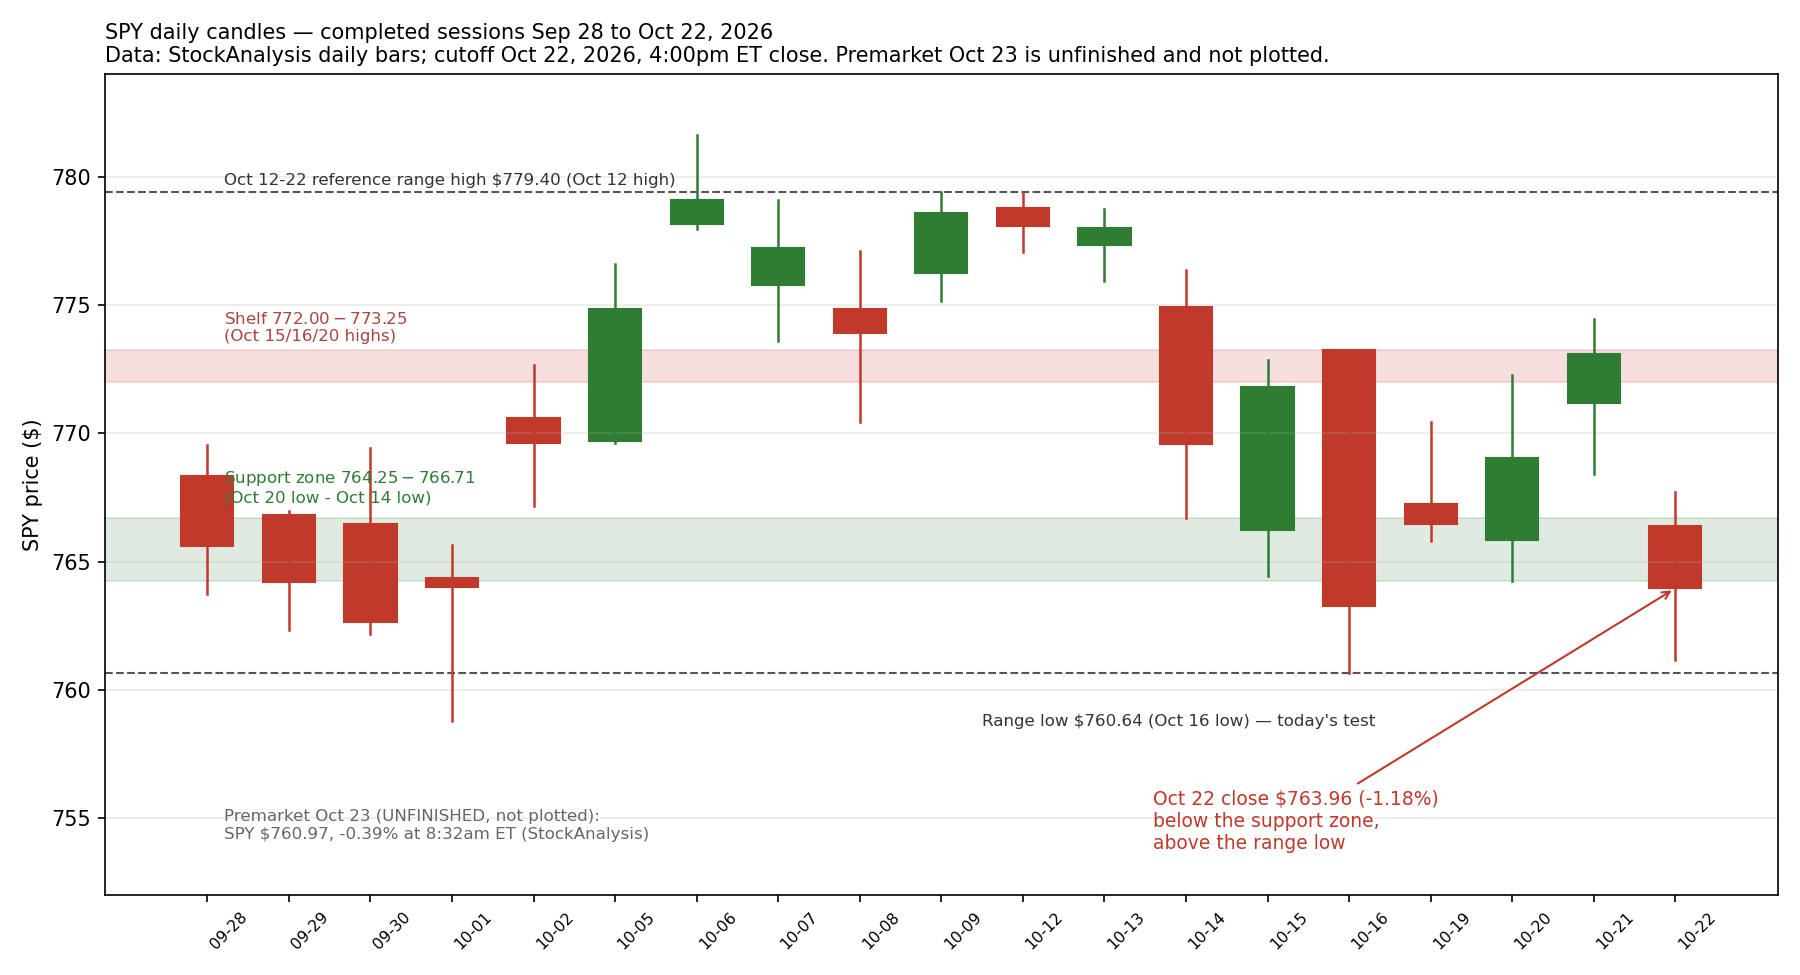
Published chart · Tap chart to enlarge.
Published chart lesson
An unfinished bar cannot break a range. A range low is a completed-bar fact — SPY's $760.64 was set by the Oct 16 completed low (StockAnalysis daily bars) — so only a completed daily close below $760.64 grades the Oct 12-22 range as broken. This morning's premarket print of $760.97 at 8:32am ET (StockAnalysis, unfinished) is above that low and is not a close at all: premarket prints set up the test, they do not grade it, and the same was true in reverse when premarket strength aimed at the shelf earlier this week. The lesson weakens if completed closes start landing on both sides of $760.64 without the level producing any reaction — a level price ignores has been absorbed, and the map needs redrawing.
Brief analysis source: SPY daily bars, StockAnalysis historical data, completed sessions through Oct 22, 2026 close (Oct 22 bar: open $766.37, high $767.71, low $761.17, close $763.96); premarket indication StockAnalysis, Oct 23, 2026, 8:32am ET (unfinished). Annotated chart: /today/2026-10-23-spy-range-low.png (same SPY daily series, completed through Oct 22 close; premarket not plotted). . Chart uses its own dated Yahoo series; vendor levels can differ.
Three key points
- On completed Oct 22 bars, SPY closed at $763.96 — $0.29 below the bottom of its $764.25-$766.71 support zone but above the Oct 12-22 reference-range low of $760.64 (StockAnalysis daily bars) — and this morning's unfinished premarket print of $760.97 at 8:32am ET points the open straight at that range low.
- There is no 8:30am ET release today; the scheduled tests are the S&P Global flash PMIs at 9:45am ET and the final Michigan sentiment reading at 10:00am ET, and this morning's official BMO releases included American Express (GAAP diluted EPS $5.42, adjusted $4.68) and SLB (GAAP $0.49, $0.64 excluding charges and credits).
- Options learning point: a premarket print near a level is an unfinished bar, not a break — only a completed close below $760.64 grades the range as broken, and any options position opened ahead of Wednesday's FOMC decision carries that event risk in its breakeven, not just its maximum gain.
Read the full brief and sources
- Start with the widest frame, on completed daily bars. SPY (the S&P 500 ETF) is still inside the Oct 12-22 reference range of $760.64-$779.40 — the window low set Oct 16 and the window high set Oct 12 (StockAnalysis daily bars; a min/max envelope used as an interpretive reference range, not an established box). Thursday's completed bar opened at $766.37, reached $767.71, fell to $761.17 and closed at $763.96, down 1.18% — a completed close below the support zone (next bullet) but above the range low. The range itself has not broken on a closing basis; today is the first session that starts with the price already aimed at its bottom edge, and the completed close, not the morning print, grades whether the range holds.
- Inside the range, the map from yesterday stands, one step further along. SPY's $764.25-$766.71 support zone — built from the Oct 20 low ($764.25), the Oct 15 low ($764.43) and the Oct 19 low ($765.82), with the Oct 14 low ($766.71) at its top — was closed below by $0.29 on Thursday, a narrow fail: one completed close, no retest from below yet, and no follow-through close under the range low. The $772.00-$773.25 shelf above (the Oct 15, Oct 16 and Oct 20 highs) is now two steps away, not today's question. QQQ (the Nasdaq-100 ETF) has no narrow-fail debate: it closed at $704.47, down 2.86%, with a low of $701.90 (Finnhub, Oct 22 close) — a completed close far below its own $724.55-$729.43 zone. Today's SPY test, in order: reclaim the zone from below (a close back above $764.25), or lose the range low (a close below $760.64).
- This morning's unfinished prints point at the harder of those two outcomes, but only just. SPY traded at $760.97 in premarket at 8:32am ET, down 0.39% (StockAnalysis) — $0.33 above the $760.64 range low, inside the morning, not below it on any completed bar. Index futures told a calmer version of the same story at 7:19am ET: Dow E-minis down 0.59%, S&P 500 E-minis down 0.25% and Nasdaq-100 E-minis down 0.12% (Reuters). The one general-news item that changes today's mix: telecom carriers AT&T, Verizon and T-Mobile fell more than 4% premarket after a report that SpaceX is in talks about a nationwide wireless carrier program, while tower operators Crown Castle and American Tower rose about 8.6% and 6.1% (Reuters) — a Dow and communications drag that is separate from the AI-spending selling that drove Thursday.
- Rates and oil lean against a calm open, and today's scheduled data is still ahead. The 10-year Treasury yield was back above 5% at about 5.01% this morning, up from Thursday's 4.96% close — its first close below 5% in a month (Investopedia). Brent crude futures were about 1.3% higher near $114.55 a barrel, their highest since early May, and WTI crude was up about 1.5% near $101 (Investopedia), while gold futures eased about 0.4% to $4,040 and bitcoin was little changed near $81,500. There is no 8:30am ET release today; the scheduled tests are the S&P Global flash PMIs at 9:45am ET and the final University of Michigan consumer sentiment reading at 10:00am ET. This morning's BMO earnings, verified from official releases: American Express reported GAAP diluted EPS of $5.42 and adjusted EPS of $4.68 excluding a stake-sale gain, and raised its full-year profit guide; SLB reported GAAP diluted EPS of $0.49 and $0.64 excluding charges and credits.
- Sentiment walked into Thursday already dark, and the calendar now stacks its biggest tests into one day next week. The latest AAII survey (week ended Wednesday Oct 21, published Oct 22) put bullish sentiment at 36.9%, bearish at 45.8% and the bull-bear spread at -8.9% — the votes predate Thursday's selloff, so this is the mood that met the drop, not a reaction to it. The last verified breadth figure remains the Oct 21 close, when 55% of S&P 500 members were above their 50-day average (ChartRow); no closing breadth count for Oct 22 was published at this check, so none is stated. A hold at 3.75-4.00% on Wednesday Oct 28 is now priced at about 92% (CME FedWatch via Growbeansprout, Oct 23), up from about 86% yesterday — the October hike tail shrank even as oil rose. Research candidates — questions to study, not trades to take: when a zone is closed below by a fraction, how often is it retested from below before the range low is tested, and does the telecom-versus-towers split show up in today's completed breadth the way Thursday's tech-versus-everything-else split did?
Analyst interpretation: Thursday graded the support zone a narrow fail, and this morning's unfinished premarket print near $760.97 aims the open at the one level that would turn a narrow fail into a range break — the Oct 16 low at $760.64. The evidence is genuinely two-sided: futures are only modestly lower, the October Fed hike tail shrank to about 8%, and AXP's results this morning showed affluent spending holding up; against that, the 10-year yield is back above 5%, Brent is at a five-month high, and QQQ's completed close left its zone far behind. Through a conservative put-seller's lens, this is a day to compare acting with waiting in the open. Take a clearly hypothetical example (not a market quote and not a trade): a hypothetical $5-wide put credit spread sold for a $1.25 credit has a maximum gain of $1.25, a maximum loss of $3.75 plus fees, and a breakeven at expiry of the short strike minus $1.25; if the underlying expires between the strikes with the spread worth $2.50, the result is a $1.25 loss before fees — the full maximum loss applies only at or below the long strike at expiry, and the short put carries early-assignment risk (Options Industry Council definitions). Opened today, that breakeven must also survive Wednesday's Core PCE print, the FOMC decision and big-tech earnings. Waiting, by contrast, puts no option premium at risk — it risks missing a bounce, not losing a spread. Mid-range tests are graded by closes; until one prints, patience is the position the evidence supports.
The narrow zone fail becomes a confirmed range break if SPY posts a completed close below $760.64 — the Oct 16 low that sets the bottom of the Oct 12-22 reference range — or if a retest of the $764.25-$766.71 zone from below fails, meaning a completed bar trades up into the zone and closes back below its $764.25 bottom; either would show sellers following through on a closing basis, not just in premarket prints.
The fail is invalidated if SPY posts a completed close back inside the zone (above $764.25) and then above its $766.71 top — the Oct 14 low that capped the zone — which would grade the two sessions below the zone as a dip buyers reclaimed; a later completed close above the $772.00-$773.25 shelf would be stronger evidence still, but it has not happened yet.
Sources
- SPY daily bars: Oct 12-22 reference range $760.64 (Oct 16 low) to $779.40 (Oct 12 high); support-zone lows $764.25 (Oct 20), $764.43 (Oct 15), $765.82 (Oct 19), $766.71 (Oct 14); Oct 22 open $766.37, high $767.71, low $761.17, close $763.96 — StockAnalysis historical dataCompleted sessions through Oct 22, 2026
- SPY premarket $760.97, -0.39% (unfinished indication); Oct 22 close $763.96 — stockanalysis.comOct 23, 2026, 8:32am ET (premarket, unfinished)
- At 7:19am ET: Dow E-minis down 0.59%, S&P 500 E-minis down 0.25%, Nasdaq-100 E-minis down 0.12%; AT&T, Verizon and T-Mobile down more than 4% premarket on the SpaceX carrier report, Crown Castle up 8.6% and American Tower up 6.1% — ReutersOct 23, 2026, 7:19am ET
- Stock futures point lower; WTI crude up 1.5% near $101, Brent up 1.3% near $114.55 (highest since early May), gold futures down 0.4% to $4,040, bitcoin near $81,500; 10-year Treasury yield about 5.01% this morning vs 4.96% Thursday close — InvestopediaOct 23, 2026, premarket (recent trading)
- American Express raised its 2026 profit forecast; Western Digital shares fell after earnings; Deckers Outdoor fell after an earnings miss — InvestopediaOct 23, 2026, before the open
- American Express Q3 2026 official release: GAAP diluted EPS $5.42; adjusted EPS $4.68 excluding the gain on sale of the Global Business Travel Group stake — Business WireOct 23, 2026, before the open
- SLB Q3 2026 official release: GAAP diluted EPS $0.49; diluted EPS excluding charges and credits $0.64 — Business WireOct 23, 2026, before the open
- S&P 500 breadth at the Oct 21 close: 55% of members above their 50-day average — ChartRow (latest verified closing breadth; no Oct 22 closing count published at this check)Oct 21, 2026, market close
- AAII Sentiment Survey, week ended Oct 21, 2026: bullish 36.9%, neutral 17.3%, bearish 45.8%, bull-bear spread -8.9% — AAIIPublished Oct 22, 2026 (survey week ended Oct 21, 2026)
- CME FedWatch as of Oct 23, 2026: 92% probability the Fed holds at 3.75-4.00% on Oct 28 (implying about 8% for a hike), vs about 86% hold on Oct 22 — Growbeansprout FedWatch trackerOct 23, 2026
- Nasdaq futures steady as AI selloff pauses; Stoxx Europe 600 slipped 0.6%; 10-year Treasury yields climbed 5 basis points to nudge back above 5% — WSJOct 23, 2026, morning ET
SPY closes below the range low — the Oct 12-22 range breaks on the Friday close
range break, one close only: SPY closed under the old range low while QQQ held flat, oil surged and the 10-year sat back near 5%
Chart analysis
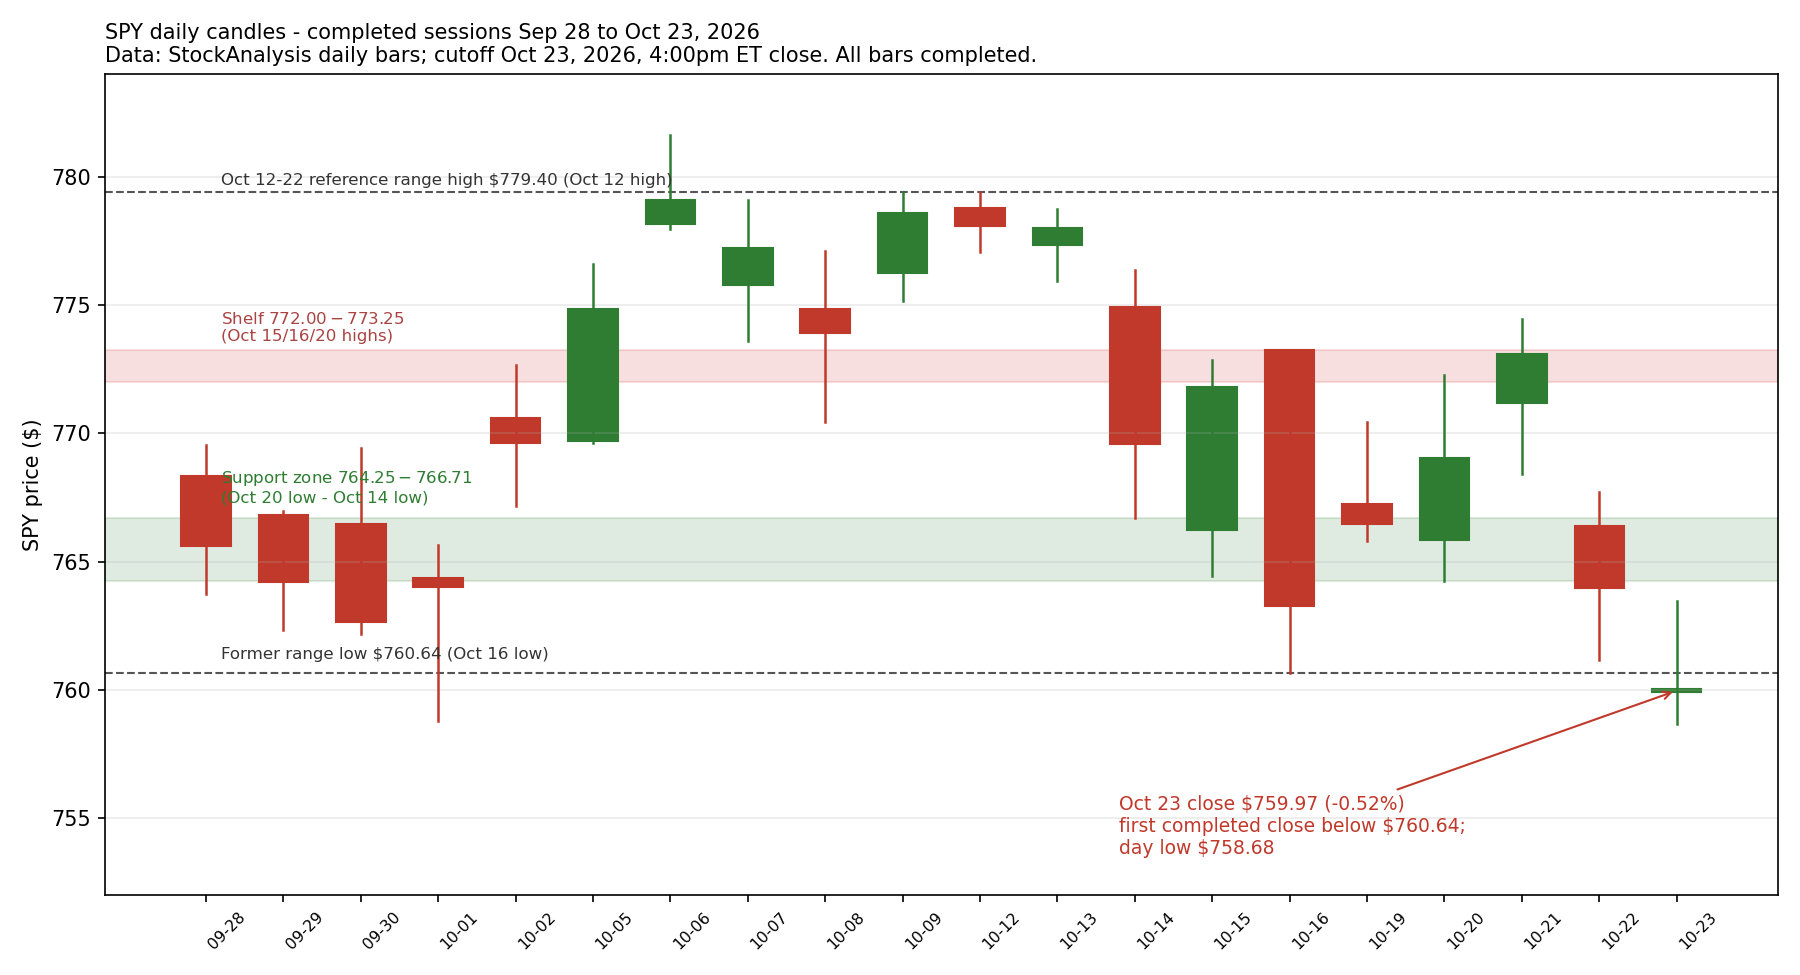
Published chart · Tap chart to enlarge.
Published chart lesson
A break is graded by the close, and its quality is graded by the retest. SPY's Oct 23 completed bar (StockAnalysis daily bars) opened below the $760.64 range low, rallied intraday to $763.47 — back above the low — and still closed at $759.97, below it: the intraday crossing did not cancel the break, because only the completed close grades it, and the close landed $0.67 under the level. What has not happened yet is a retest: a later session trading up toward $760.64 from below and showing whether sellers defend it. One close below is a narrow pass, not a finished verdict. The lesson weakens if Monday's completed close lands back above $760.64 and holds there — a break that is immediately reclaimed was a dip through the level, not a range change, and the map reverts to the old range.
Brief analysis source: SPY daily bars, StockAnalysis historical data, completed sessions through Oct 23, 2026 close (Oct 23 bar: open $759.90, high $763.47, low $758.68, close $759.97); range low $760.64 from the Oct 16 completed low in the same series. Annotated chart: /today/2026-10-23-spy-range-break.png (same SPY daily series, completed through Oct 23 close). . Chart uses its own dated Yahoo series; vendor levels can differ.
Three key points
- SPY posted its first completed close below the Oct 12-22 reference-range low on Oct 23 — $759.97, down 0.52%, against the $760.64 Oct 16 low (StockAnalysis daily bars) — a one-close, narrow grade of a range break, with no closing-basis retest yet.
- Friday's index losses were led by the Dow (-1.2%) rather than tech (Nasdaq Composite -0.2%, QQQ -0.01%) while WTI crude rose 4% to $103.45 at 4:00pm ET and the 10-year yield returned to near 5.01% (Investopedia).
- Options learning point: a break graded by one close is evidence, not certainty — any new options position opened Monday must carry next week's stacked event risk (FOMC decision Wednesday, Core PCE Thursday, Alphabet/Microsoft/Amazon earnings) in its breakeven, and waiting puts no option premium at risk.
Read the full brief and sources
- Start with the widest frame, on completed daily bars, and grade the morning's test. SPY (the S&P 500 ETF) opened at $759.90, reached $763.47, fell to $758.68 and closed at $759.97, down 0.52% (StockAnalysis daily bars, completed Oct 23 bar) — the first completed close below the $760.64 low that set the bottom of the Oct 12-22 reference range (the Oct 16 low; the window high was $779.40 on Oct 12; a min/max envelope used as an interpretive reference range, not an established box). The morning brief's test was explicit: a completed close below $760.64 grades the range as broken. That close has now printed, by $0.67 — one close, so a narrow pass for the break on the grading used in these briefs, with no retest of the level from below on a closing basis yet.
- Inside the old range, the levels above are now the map in reverse. Friday's high of $763.47 (completed daily bar) never reached the bottom of the $764.25-$766.71 support zone — built from the Oct 20 low ($764.25), the Oct 15 low ($764.43), the Oct 19 low ($765.82) and the Oct 14 low ($766.71) at its top — so that zone, closed below for a second straight session, now sits overhead as the first area a recovery would have to reclaim, with the $772.00-$773.25 shelf (the Oct 15, Oct 16 and Oct 20 highs) above it. QQQ (the Nasdaq-100 ETF) told a steadier story at the close: it opened at $702.20, traded between $701.16 and $709.30 and closed at $704.40, down 0.01% (StockAnalysis) — essentially flat after Thursday's 2.86% fall, holding its close above both days' lows even though its intraday low edged below Thursday's $701.90.
- The index scoreboard shows where Friday's selling actually sat. The Dow Jones Industrial Average fell 1.2% (about 650 points), the S&P 500 index fell 0.5% and the Nasdaq Composite fell 0.2%, while the Russell 2000 fell 0.3% (Investopedia closing recap; IBD live coverage for the Russell). Energy and information technology were the only two S&P 500 sectors to finish higher (Investopedia) — a narrow green list on a down day. No closing breadth count for Oct 23 (such as the share of S&P 500 members above their 50-day average) was published at this check, so none is stated; the sector split is the participation evidence available tonight.
- Rates, oil and the day's data kept the pressure on from outside stocks. The 10-year Treasury yield rose to near 5.01% in late-afternoon trading, back above Thursday's 4.96% close (Investopedia). WTI crude futures were up 4% to $103.45 a barrel at 4:00pm ET and Brent crude futures were up 3.4% to $117, their highest since late April, as Middle East tensions escalated (Investopedia). Gold futures fell 1.2% to $4,010 an ounce and bitcoin traded near $81,200, down modestly over 24 hours, with ether near $2,395 (Investopedia; Finnhub). The day's scheduled data split two ways: the S&P Global flash composite PMI printed 57.6, with manufacturing at 56.0 and services at 57.9, while the final University of Michigan consumer sentiment reading was revised up to 48.0 from the 46.3 preliminary print, with one-year inflation expectations at 4.7% and five-year at 3.5% (CAMS midday check; Seeking Alpha via TradingView).
- Single names moved on the two stories the morning flagged. On the SpaceX carrier report, Crown Castle surged 9.5% and American Tower rose 4%, while AT&T, Verizon and T-Mobile fell between 1.5% and 7.5% (Investopedia). Post-earnings reactions from Thursday night's and this morning's reports were mostly lower: Bloom Energy sank 11%, Deckers Outdoor fell 5%, Newmont fell 4.5%, American Express fell about 4% despite raising its full-year profit guide, and Western Digital fell 2.5% (Investopedia). Tonight's after-close earnings slate is small — no mega-cap names report Friday evening — and, per the chronology these briefs keep, today's 4:00pm ET close precedes those releases: the close graded today's range test, and any after-hours response is tonight's separate development, with the next full session on Monday as the follow-up evidence.
Analyst interpretation: the morning's test printed the harder outcome — a completed close below $760.64 — but it printed narrowly, by $0.67, on a day when the Nasdaq Composite fell only 0.2% and QQQ closed flat, while the Dow did most of the falling and oil, not tech, supplied the pressure. That mix argues for grading, not drama: one close below a range low is a narrow pass for a break, and the evidence that would upgrade or cancel it — a retest of $760.64-$764.25 from below, or a close back inside the range — has not happened yet. Through a conservative put-seller's lens, the calendar matters more than the $0.67. Take a clearly hypothetical example (not a market quote and not a trade): a hypothetical $5-wide put credit spread sold for a $1.25 credit has a maximum gain of $1.25, a maximum loss of $3.75 plus fees, and a breakeven at expiry of the short strike minus $1.25; if the underlying expires between the strikes with the spread worth $2.50, the result is a $1.25 loss before fees — the full maximum loss applies only at or below the long strike at expiry, and the short put carries early-assignment risk (Options Industry Council definitions). Opened next week, that breakeven must survive the FOMC decision, the Core PCE print and three mega-cap earnings reports in four sessions. Waiting, by contrast, puts no option premium at risk — it risks missing a snap-back, not losing a spread. Research candidates — questions to study, not trades to take: how often does a one-close range break this narrow get a retest from below before any follow-through, and does breadth confirm the break on Monday the way Thursday's split session refused to confirm the selloff?
The range break is confirmed in steps: a second completed close below $760.64 — the Oct 16 low that set the bottom of the Oct 12-22 reference range — would add follow-through, and a retest from below that trades up into the $760.64-$764.25 area (the old range low up to the Oct 20 low at the bottom of the former support zone) and then closes back below $760.64 would show sellers defending the level they took; either is closing-basis evidence, not an intraday print.
The break is invalidated if SPY posts a completed close back above $760.64, returning the price to the Oct 12-22 reference range, and the read is fully reversed if a later completed close also reclaims the $764.25-$766.71 zone — above its $764.25 bottom (the Oct 20 low) and then its $766.71 top (the Oct 14 low) — which would grade Friday's close below the range as a one-session dip that buyers took back.
Opened new positions today, per confirmed fills recorded in the activity log. (No other broad action is stated; anything not in the log is awaiting confirmation.)
Sources
- SPY daily bars: Oct 23 open $759.90, high $763.47, low $758.68, close $759.97 (-0.52%); Oct 12-22 reference range $760.64 (Oct 16 low) to $779.40 (Oct 12 high); support-zone lows $764.25 (Oct 20), $764.43 (Oct 15), $765.82 (Oct 19), $766.71 (Oct 14) — StockAnalysis historical dataCompleted sessions through Oct 23, 2026, 4:00pm ET close
- QQQ daily bar Oct 23: open $702.20, high $709.30, low $701.16, close $704.40 (-0.01%); Oct 22 low $701.90, close $704.47 — StockAnalysis historical dataCompleted sessions through Oct 23, 2026, 4:00pm ET close
- Closing recap: Dow -1.2% (about 650 points), S&P 500 -0.5%, Nasdaq Composite -0.2%; Dow higher for the week (+0.4%), S&P 500 -0.5% and Nasdaq -0.7% for the week; energy and information technology the only green S&P 500 sectors; Crown Castle +9.5%, American Tower +4%, carriers down 1.5% to 7.5%; Bloom Energy -11%, Deckers -5%, Newmont -4.5%, American Express about -4%, Western Digital -2.5%; WTI +4% to $103.45 at 4pm ET, Brent +3.4% to $117 (highest since late April); 10-year yield near 5.01% late afternoon vs 4.96% Thursday close; gold futures -1.2% to $4,010; bitcoin near $81,200 — InvestopediaOct 23, 2026, after the close
- Russell 2000 fell 0.3% Friday; Dow fell about 1.1-1.2% in afternoon trade with American Express pacing decliners; WTI crude futures climbed nearly 4% to around $103.40 — Investor's Business Daily live coverageOct 23, 2026, afternoon ET (live coverage, updated after the close)
- S&P Global flash PMIs: composite 57.6, selling prices rose at the fastest pace since August 2022; midday WTI $102.96, Brent $116.99, 10-year yield 4.994% — CAMS Midday Market CheckOct 23, 2026, midday ET
- University of Michigan final October sentiment revised to 48.0 from the 46.3 preliminary print (September 48.1); current conditions 46.7, expectations 48.8; one-year inflation expectations 4.7%, five-year 3.5% — Seeking Alpha via TradingViewOct 23, 2026, 10:02am ET release (published 14:02 UTC)
- Flash PMI detail: manufacturing 56.0 (strongest since early 2022), services 57.9 vs 58.8 in September — StockMarketWatch summary of the S&P Global releaseOct 23, 2026
- Ether near $2,395, up 0.52% on the session quote (Binance spot via Finnhub) — FinnhubOct 23, 2026, after the close (latest quote at retrieval)
- Next week: Verizon reports Monday Oct 26; Tuesday Oct 27 durable orders, consumer confidence, and Visa, Coca-Cola and Boeing earnings; Wednesday Oct 28 FOMC decision and Alphabet and Microsoft earnings after the close; Thursday Oct 29 Q3 GDP and September PCE/Core PCE, Amazon after the close — Morningstar week-ahead calendarWeek of Oct 26-30, 2026 (published Oct 23, 2026)