
Daily brief · 2026-10-22
Historical edition · New York time. These observations reflect their published date, not current market conditions.
SPY closed inside its shelf, futures point below it — today's close grades the test
range repair meets an oil-and-AI shock: SPY closed inside the 772-773.25 shelf, breadth improved to 55%, 10-year back near 5.05%
Chart analysis
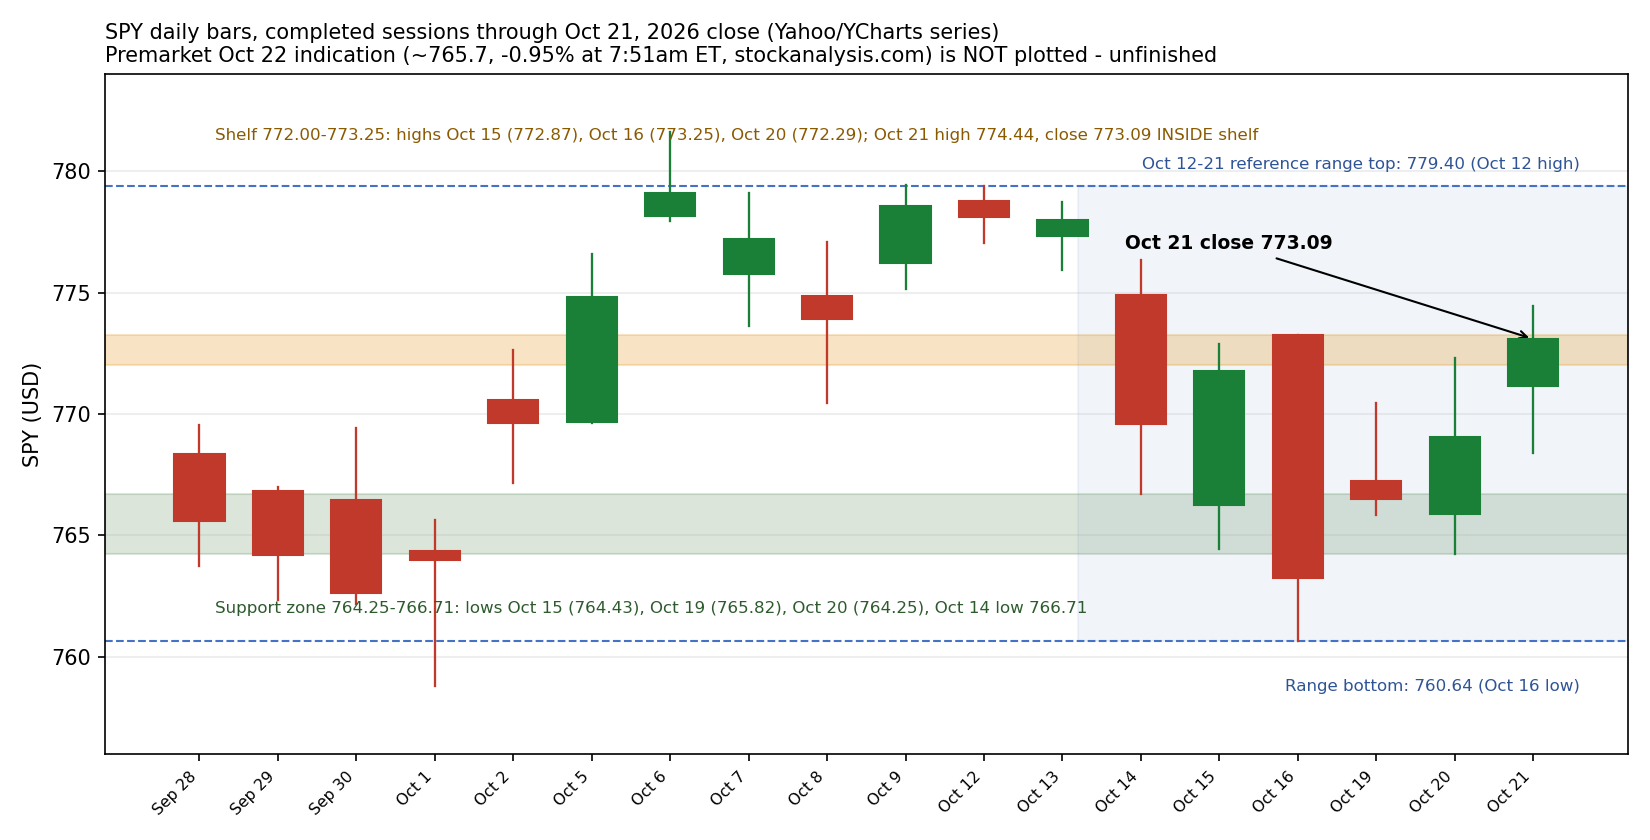
Published chart · Tap chart to enlarge.
Published chart lesson
A close inside the zone is a test still in progress. SPY's $772.00-$773.25 shelf was built by three completed-bar highs ($772.87 on Oct 15, $773.25 on Oct 16, $772.29 on Oct 20, YCharts daily bars). On Oct 21 the price traded above the shelf intraday, to $774.44, but the completed close was $773.09 — inside the zone, 16 cents below its top. That is neither confirmation nor rejection: a shelf break confirms only on a completed close beyond the zone plus a retest that holds, and a push is graded a false break only when a completed close falls back below the zone. One close is a narrow pass or a narrow fail; an unfinished premarket print — SPY indicated near $765.74 at 7:51am ET — grades nothing at all. The lesson weakens if SPY starts closing through the shelf in both directions without reacting to it: a zone price ignores has been absorbed, and the map needs redrawing.
Brief analysis source: SPY daily bars, YCharts historical data (Oct 21 bar cross-checked vs Finnhub/alphatradernews: open $771.17, high $774.44, low $768.40, close $773.09), completed sessions through Oct 21, 2026; premarket indication stockanalysis.com, Oct 22, 2026, 7:51am ET (unfinished). Annotated chart: /today/2026-10-22-spy-shelf.png (same SPY daily series, completed through Oct 21 close; premarket not plotted). . Chart uses its own dated Yahoo series; vendor levels can differ.
Three key points
- On completed Oct 21 bars, SPY closed at $773.09 — inside its $772.00-$773.25 shelf after a $774.44 high — and QQQ closed at $725.20 inside its $724.55-$729.43 zone (YCharts/Finnhub daily bars), so neither shelf break is confirmed ahead of a premarket gap down toward the $764.25-$766.71 support zone.
- This morning's 8:30am ET jobless claims fell to 194,000 versus 200,000 expected (Reuters/Labor Department), so the day's pressure is the overnight mix — Nasdaq-100 futures down about 1.7% as Tesla and Meta fell after results, Brent crude above $112 (Reuters/Investopedia) — not the data; the 10-year yield eased to about 5.05%.
- For options learners: a gap through a shelf is not a graded test — confirmation still needs a completed close and a held retest, and waiting for that completed bar puts no option premium at risk while the shelf, the support zone and tonight's after-close earnings do the grading in order.
Read the full brief and sources
- Start with the widest frame. On completed daily bars, SPY (the S&P 500 ETF) is working inside the Oct 12-21 reference range of $760.64-$779.40 — the window low set Oct 16 and the window high set Oct 12 (YCharts daily bars; a min/max envelope used as an interpretive reference range, not an established box). The wider Oct 1-21 span runs $758.79-$781.62. Wednesday's completed bar opened at $771.17, reached $774.44 and closed at $773.09 (+0.53%) — inside the range's upper half, with no completed close outside it. Until a completed close escapes the range, the honest description is still repair inside it, and every push toward a boundary is a test graded by the close.
- Inside the range, the shelf did its job again — narrowly. SPY's $772.00-$773.25 shelf is built from three completed-bar highs (Oct 15: $772.87; Oct 16: $773.25; Oct 20: $772.29). Wednesday added a fourth touch: the high poked to $774.44, above the shelf, but the completed close at $773.09 landed INSIDE the shelf, below its $773.25 top — so the shelf break is neither confirmed (that needs a completed close above $773.25, then a retest that holds) nor a false break (that needs a close back below $772). QQQ (the Nasdaq-100 ETF) closed at $725.20, inside its own $724.55-$729.43 zone (the Oct 19 and Oct 15 highs) and below its top. This morning's unfinished premarket indications point below both zones — SPY near $765.74 (-0.95% at 7:51am ET, stockanalysis.com) and QQQ near $713.86 (-1.56% at 8:44am ET, Finnhub) — which would open the session testing the $764.25-$766.71 support zone built from the Oct 15, Oct 19 and Oct 20 lows, with the Oct 14 low ($766.71) at its top. Premarket prints are unfinished bars: they set up the test, they do not grade it.
- The 8:30am ET data did not add a second shock. Initial jobless claims fell 6,000 to 194,000 for the week ended Oct 17, below the 200,000 economists expected (Reuters, citing the Labor Department) — near 57-year lows, with continuing claims at 1.728 million. The labor market's 'low-hire, low-fire' state held through the survey week for October's payroll report. That leaves today's pressure where it started: not the data, but the overnight mix of higher oil and renewed AI-spending questions (next bullet). Still ahead today: the leading indicators index at 10:00am ET and the Kansas City Fed manufacturing index at 11:00am ET.
- The overnight shock is real but specific, and it is the one general-news item that changes today's structure read. Nasdaq-100 futures were down about 1.7% and S&P 500 futures about 1.0% recently (Investopedia), after Tesla fell 5.3% premarket despite an earnings beat — it cut its capital-spending forecast — and Meta slipped about 1.9% after introducing new non-voting shares to fund its AI buildout (Reuters); Lam Research dropped about 7% on a disappointing outlook and the semiconductor ETF (SOXX) fell more than 3%. At the same time Brent crude climbed above $112 a barrel after renewed Houthi attacks in Saudi Arabia raised supply-disruption fears (Reuters), while WTI crude traded near $99.50 and gold futures fell nearly 2% to about $4,075 — gold did not act as the day's hedge. The 10-year Treasury yield fell to about 5.05% this morning from 5.13% at Wednesday's close (Investopedia) as prices rose, and the VIX, which closed at 16.68 Wednesday, was indicated near 18.4 before the open (Cboe via ad-hoc-news). Breadth underneath Wednesday's index gain was constructive: 55% of S&P 500 members closed above their own 50-day average (275 of 499), advancers beat decliners 283 to 216, and new highs beat new lows 25 to 3 (ChartRow, Oct 21 close).
- Retail sentiment darkened before any of last night's news. The fresh AAII survey (week ended Wednesday Oct 21, published this morning) puts bullish sentiment at 36.9% (-1.8 points), bearish at 45.8% (+4.2 points) and neutral at 17.3% — a bull-bear spread of -8.9%, with bearish sentiment well above its 31.5% historical average. The votes predate the Meta and Tesla reports, so this is the mood that walked into the shock, not a reaction to it. The dated tests ahead: Western Digital, Newmont, Deckers Outdoor and Bloom Energy report after today's close — today's 4:00pm ET completed close grades today's shelf test BEFORE those reports land, and their after-hours response plus Friday's full session are separate, later evidence. Friday brings American Express and SLB before the open, and the Fed decides Wednesday Oct 28 at 2:00pm ET, with a hold at 3.75-4.00% priced at about 86% (CME FedWatch). Research candidates — questions to study, not trades to take: how does a shelf behave when the session gaps straight through it rather than testing it from above, and does the $764.25-$766.71 zone — three completed-bar lows — react the way the shelf did on its touches?
Analyst interpretation: Wednesday's session improved the range's internals — breadth widened to 55% above the 50-day average and SPY finally closed inside the shelf that capped three earlier pushes — without changing the range itself. This morning's gap aims the open at the support zone instead of the shelf, and it arrives with the 10-year yield easing, not spiking, and with claims still near historic lows: the shock is about AI spending and oil, not about rates or jobs, on the evidence available at the open. Through a conservative put-seller's lens, a gap is the hardest open to grade honestly — it skips the test and starts mid-question. The completed close is what separates a shelf that flipped from a morning that overreacted, and the calendar is stacked in the right order to grade patiently: today's close first, tonight's after-hours earnings second, Friday's full session third, the Fed on Oct 28 last. Mid-range, with no boundary cleanly tested yet, waiting is a valid position.
A completed SPY close above $773.25 — the top of the shelf on completed bars — that then survives a retest (a later session dipping toward the shelf and closing back above it), together with a completed QQQ close above $729.43, the top of its zone, would confirm the shelves are flipping from caps to floors and the Oct 12-21 range is resolving upward. A completed close back inside the $772.00-$773.25 shelf after a gap-down open would separately show the premarket shock was absorbed at the shelf, though it would not by itself confirm a break.
A completed SPY close below $772 after Wednesday's intraday push above the shelf would grade that push a false break; a completed close below $764.25 — the bottom of the support zone built from the Oct 15, Oct 19 and Oct 20 lows — would show the zone failed on its first test and reopen the lower half of the range toward $760.64, the Oct 16 window low. A QQQ completed close below $724.55 would confirm its zone rejected price from underneath.
Sources
- SPY daily bars: Oct 12-21 reference range $760.64 (Oct 16 low) to $779.40 (Oct 12 high); shelf highs $772.87 (Oct 15), $773.25 (Oct 16), $772.29 (Oct 20); Oct 21 open $771.17, high $774.44, low $768.40, close $773.09 — YCharts historical dataCompleted sessions through Oct 21, 2026
- SPY premarket $765.74, -0.95% (unfinished indication); Oct 21 close $773.09, +0.53% — stockanalysis.comOct 22, 2026, 7:51am ET (premarket, unfinished)
- QQQ Oct 21 bar: open $722.22, high $727.95, low $719.71, close $725.20 (+1.05%) — alphatradernews market table; premarket $713.86, -1.56% at 8:44am ET — FinnhubCompleted session Oct 21, 2026; premarket Oct 22, 2026, 8:44am ET (unfinished)
- Jobless claims fell 6,000 to 194,000 for the week ended Oct 17 vs 200,000 forecast; continuing claims 1.728 million — Reuters, citing the Labor DepartmentOct 22, 2026, 8:30am ET release
- Futures recently: Nasdaq-100 down 1.7%, S&P 500 down 1%, Dow down 0.6%; 10-year yield 5.05% this morning vs 5.13% at Wednesday's close; WTI near $99.50, gold futures near $4,075, bitcoin near $81,600; Tesla down after results, Lam Research down about 7% — InvestopediaOct 22, 2026, morning ET before the open
- Nasdaq 100 E-minis down 1.93%, S&P 500 E-minis down 1.1%, Dow E-minis down 0.69% at 4:56am ET; Brent crude above $112 after Houthi attacks in Saudi Arabia; Tesla -5.3% and Meta -1.9% premarket — ReutersOct 22, 2026, 4:56am ET futures snapshot
- S&P 500 breadth at the Oct 21 close: 55% of members above their 50-day average (275 of 499), advancers 283 vs decliners 216, new highs 25 vs new lows 3 — ChartRowOct 21, 2026, market close
- AAII Sentiment Survey, week ended Oct 21, 2026: bullish 36.9%, neutral 17.3%, bearish 45.8% — AAIIPublished Oct 22, 2026 (survey week ended Oct 21, 2026)
- CME FedWatch as of Oct 22, 2026: 86.2% probability the Fed holds at 3.75-4.00% on Oct 28 — Growbeansprout FedWatch trackerOct 22, 2026
- Wednesday Oct 21 index closes: S&P 500 +0.58% to 7,757.17, Dow +0.69% to 52,856.09, Nasdaq Composite +1.05% to 26,703; VIX closed 16.68, premarket indication 18.38 — Reuters/Investopedia/Cboe compiled by ad-hoc-newsOct 21, 2026 close; VIX indication Oct 22, 2026, 7:51am ET
- Calendar: Oct 22 after close — Western Digital, Newmont, Deckers Outdoor, Bloom Energy; Oct 23 before open — American Express, SLB — The Closing Print week-ahead earnings calendarPublished Oct 18, 2026, for the week of Oct 19, 2026
SPY closes below its support zone at $763.96 — a narrow fail; the range low still holds
tech-led drop through the shelf: SPY under its support zone but above the range low, Dow flat, 10-year back below 5%
Chart analysis
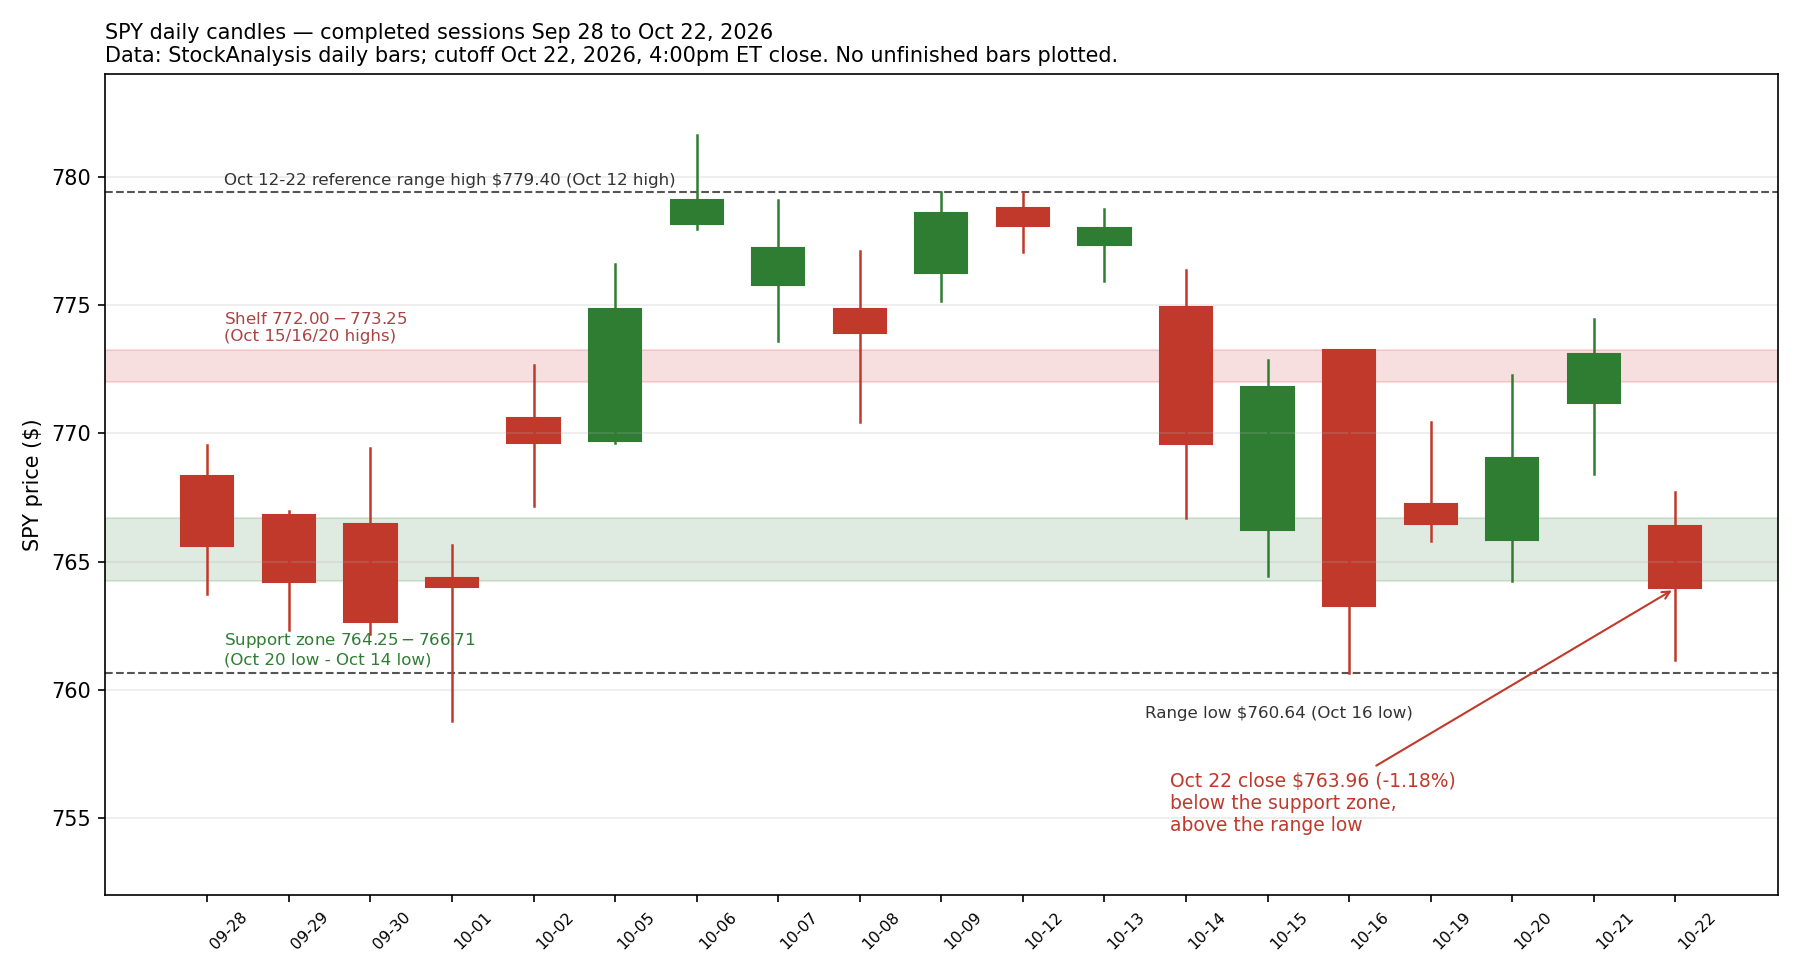
Published chart · Tap chart to enlarge.
Published chart lesson
A close below a zone by a small amount is a narrow fail, not a collapse. SPY's $764.25-$766.71 support zone was built by three completed-bar lows — $764.25 on Oct 20, $764.43 on Oct 15 and $765.82 on Oct 19, with the Oct 14 low of $766.71 at its top (StockAnalysis daily bars). On Oct 22 SPY traded down to $761.17 but completed the session at $763.96, $0.29 below the zone's bottom and still above the Oct 16 range low of $760.64. Zones are areas where price reacted before, not lines that flip a switch: one close a fraction below the bottom grades the test as failed narrowly, and the follow-through — a second close below, a failed retest from underneath, or a close back inside the zone — is what turns a narrow fail into a break or a recovery. The lesson weakens if SPY starts closing on both sides of the zone without reacting to it at all: a zone price ignores has been absorbed, and the map needs redrawing.
Brief analysis source: SPY daily bars, StockAnalysis historical data, completed sessions through Oct 22, 2026 close (Oct 22 bar: open $766.37, high $767.71, low $761.17, close $763.96). Annotated chart: /today/2026-10-22-spy-close.png (same SPY daily series, completed through Oct 22 close). . Chart uses its own dated Yahoo series; vendor levels can differ.
Three key points
- SPY closed at $763.96, down 1.18% on completed daily bars (StockAnalysis) — $0.29 below the bottom of its $764.25-$766.71 support zone but above the Oct 16 reference-range low of $760.64, so the morning's shelf test grades a narrow fail, not a range break.
- The selloff was concentrated in AI-linked tech: the Nasdaq Composite fell 2.6% to 26,008.86 and QQQ fell 2.86% to $704.47 while the Dow ended up 0.02% and IWM up 0.07% (WSJ; Finnhub), and the 10-year Treasury yield fell back below 5% to about 4.97% (Investopedia).
- Options learning point: a close just below a zone is graded evidence, not a signal to act — waiting puts no option premium at risk, while any defined-risk spread taken into tonight's earnings and Wednesday's Fed decision carries event risk that must be priced into its breakeven, not just its max gain.
Read the full brief and sources
- Start with the widest frame, on completed daily bars. SPY (the S&P 500 ETF) is still inside the Oct 12-22 reference range of $760.64-$779.40 — the window low set Oct 16 and the window high set Oct 12 (StockAnalysis daily bars; a min/max envelope used as an interpretive reference range, not an established box). Today's completed bar opened at $766.37, reached $767.71, fell to $761.17 and closed at $763.96, down 1.18%. That close grades the morning's test plainly: the session gapped below the $772.00-$773.25 shelf, never traded back up to it (the day's high was $767.71), and closed $0.29 below the bottom of the $764.25-$766.71 support zone — the zone built from the Oct 20 low ($764.25), the Oct 15 low ($764.43) and the Oct 19 low ($765.82), with the Oct 14 low ($766.71) at its top. One completed close below a zone is a narrow fail, not a range break: the Oct 16 range low at $760.64 was tested intraday ($761.17) but not closed below.
- Tech took the damage, and it was concentrated. QQQ (the Nasdaq-100 ETF) closed at $704.47, down 2.86%, with a low of $701.90 (Finnhub, Oct 22 regular-session close) — a completed close far below its own $724.55-$729.43 zone, so for QQQ there is no narrow-fail debate. The Nasdaq Composite fell 2.6% to 26,008.86, its biggest drop since June, and the S&P 500 index fell 1.21% to 7,663.43, while the Dow Jones Industrial Average ended up 0.02% at 52,867.98 (WSJ closing figures). Chip stocks led the fall: the PHLX Semiconductor index tumbled 6.7% and the iShares Semiconductor ETF (SOXX) fell about 6.5% (WSJ; Investopedia), as renewed questions about whether AI spending earns its cost — raised by Meta's added spending commitments and Lam Research's supply-constrained outlook — coincided with the selling. Meta fell about 7%, Lam Research about 12%, SpaceX 9% and Tesla 3%, while Moderna fell 18% on a reported data leak (Investopedia).
- Underneath the index drop, the average stock held up far better — that divergence is today's breadth fact. The small-cap ETF IWM closed up 0.07% at $276.67 (Finnhub), homebuilders jumped as yields fell (D.R. Horton up 6.2%, MarketOne), and at midday 320 S&P 500 members were advancing against fewer than 200 decliners, with the equal-weight S&P fund up 0.23% even as the cap-weighted index fell about 1.3% (Seeking Alpha, midday reading — labelled midday because no closing breadth count was published at this check; the latest S5FI moving-average breadth figure remains the Oct 21 reading of 55% of members above their 50-day average from this morning's brief). A 1%-plus index drop on mostly positive breadth is a leadership problem — the largest tech names falling — not broad selling, and the two need different responses.
- Rates moved the other way from stocks, and oil moved against both. The 10-year Treasury yield fell to about 4.97% in late-afternoon trade, down about 16 basis points from Wednesday's close and below 5% for the first time in a month, in the yield's biggest one-day decline in more than two years; the 2-year fell about 19 basis points to 4.635% (Investopedia; WSJ). At 4:00pm ET, WTI crude futures were up 2.2% at $99.30 a barrel and Brent up 4% at $113.10, its highest since early May, as reports of planned U.S.-Israeli strikes on Iran and Houthi attacks in Saudi Arabia kept supply risk priced in (Investopedia). Gold futures fell 2.6% to $4,040 an ounce — again not the day's hedge — and crypto fell with tech: bitcoin traded near $81,364, down 3.7% on its day bar, and ether near $2,385, down 4.3% (Finnhub, Binance spot).
- Tonight's earnings are separate, later evidence — they grade Friday's session, not today's 4:00pm ET close. Western Digital beat the bar: GAAP diluted EPS of $4.63 and non-GAAP EPS of $4.64 on revenue of $4.38 billion against $4.14 billion expected (FactSet via WSJ), with fiscal second-quarter adjusted EPS guidance of $5.60-$6.00, and the shares rose about 1.8% after hours to $360.64 after falling 6.4% in the regular session (Barron's). Deckers Outdoor reported GAAP diluted EPS of $2.31 against $1.79 expected on revenue of $1.48 billion, and Bloom Energy reported GAAP diluted EPS of $0.78 and non-GAAP EPS of $0.94 on revenue of $1.24 billion and raised its full-year revenue guidance (company releases, via Seeking Alpha and the Business Wire release text). Omnicom reported GAAP diluted EPS of $2.38 and non-GAAP adjusted EPS of $2.73 (PR Newswire, transmitted 4:03pm ET), and Comfort Systems USA reported GAAP diluted EPS of $13.91 on revenue of $3.77 billion (company release, via Seeking Alpha summary). Newmont, VeriSign and SS&C had not published official releases at this ~5:05pm ET check — Newmont's conference call is at 5:30pm ET — so no results are stated for them here; their after-hours response and Friday's full session are the evidence that counts.
Analyst interpretation: today graded the shelf test the morning set — a gap through the shelf and a close just below the support zone — but the evidence is one close, $0.29 below the zone, with the range low untouched on a closing basis and breadth far better than the index. That is a narrow fail inside a wider range, mid-evidence, not a confirmed breakdown. The conservative read is patience: tonight's after-hours earnings and Friday's full session are the next evidence, and they arrive before any retest can grade the zone from below. On the options side, compare acting now with waiting, using a clearly hypothetical example (not a market quote and not a trade): a hypothetical debit call spread bought for a $3.00 debit with a $10-wide spread has a max gain of $7.00, a max loss of the $3.00 debit plus fees, and a breakeven at expiry of the long strike plus $3.00; if the underlying expires between the strikes — say $5.00 of spread value — the result is a $2.00 gain before fees, not the full $7.00, and the full debit is lost only at or below the long strike at expiry. Early assignment on the short leg and pin risk near expiry are real costs of that structure (Options Industry Council definitions). Waiting, by contrast, puts no option premium at risk at all — it risks missing a move, not losing a debit. Research candidates — questions to study, not trades to take: does a zone that price closes just below get retested from underneath within a few sessions, and does today's positive-breadth divergence repeat if tech falls again on Friday?
The narrow fail becomes a confirmed break if SPY posts a completed close below $760.64 — the Oct 16 low that sets the bottom of the Oct 12-22 reference range — or if a retest of the $764.25-$766.71 zone from below fails, meaning a completed bar trades up into the zone and closes back below its $764.25 bottom; either would show sellers following through, not just gapping once.
The fail is invalidated if SPY posts a completed close back inside the zone (above $764.25) and then above its $766.71 top — the Oct 14 low that capped the zone — which would grade today as a one-day dip below the zone that buyers reclaimed; a later completed close above the $772.00-$773.25 shelf would be stronger evidence still, but it has not happened yet.
Awaiting confirmation — no confirmed fills dated Oct 22 were in the activity record at this check (the latest logged fill is dated Oct 20); nothing is inferred from that absence.
Sources
- U.S. tech stocks drop on AI spending concerns, closing index figures — wsj.comOct 22, 2026, ~4:00pm ET close
- Stock market today: Nasdaq, S&P 500 end sharply lower; 10-year below 5% — investopedia.comOct 22, 2026, ~4:00pm ET
- SPY historical daily bars — stockanalysis.comOct 22, 2026, 4:00pm ET close
- QQQ regular-session close — finnhub.ioOct 22, 2026 regular-session close
- The Closing Bell, Oct 22 2026 — marketone.ioOct 22, 2026, after the close
- Bad day, decent breadth (midday breadth reading) — seekingalpha.comOct 22, 2026, midday ET
- IWM regular-session close — finnhub.ioOct 22, 2026 regular-session close
- Western Digital profit grows on data storage demand — wsj.comOct 22, 2026, after the close
- Western Digital stock rises as earnings ease slowdown fears — barrons.comOct 22, 2026, after-hours
- Omnicom reports third quarter 2026 results — prnewswire.comOct 22, 2026, 4:03pm ET